Gold Prices Drop to $2,326 Amid US Treasury Yields and Middle East Tensions
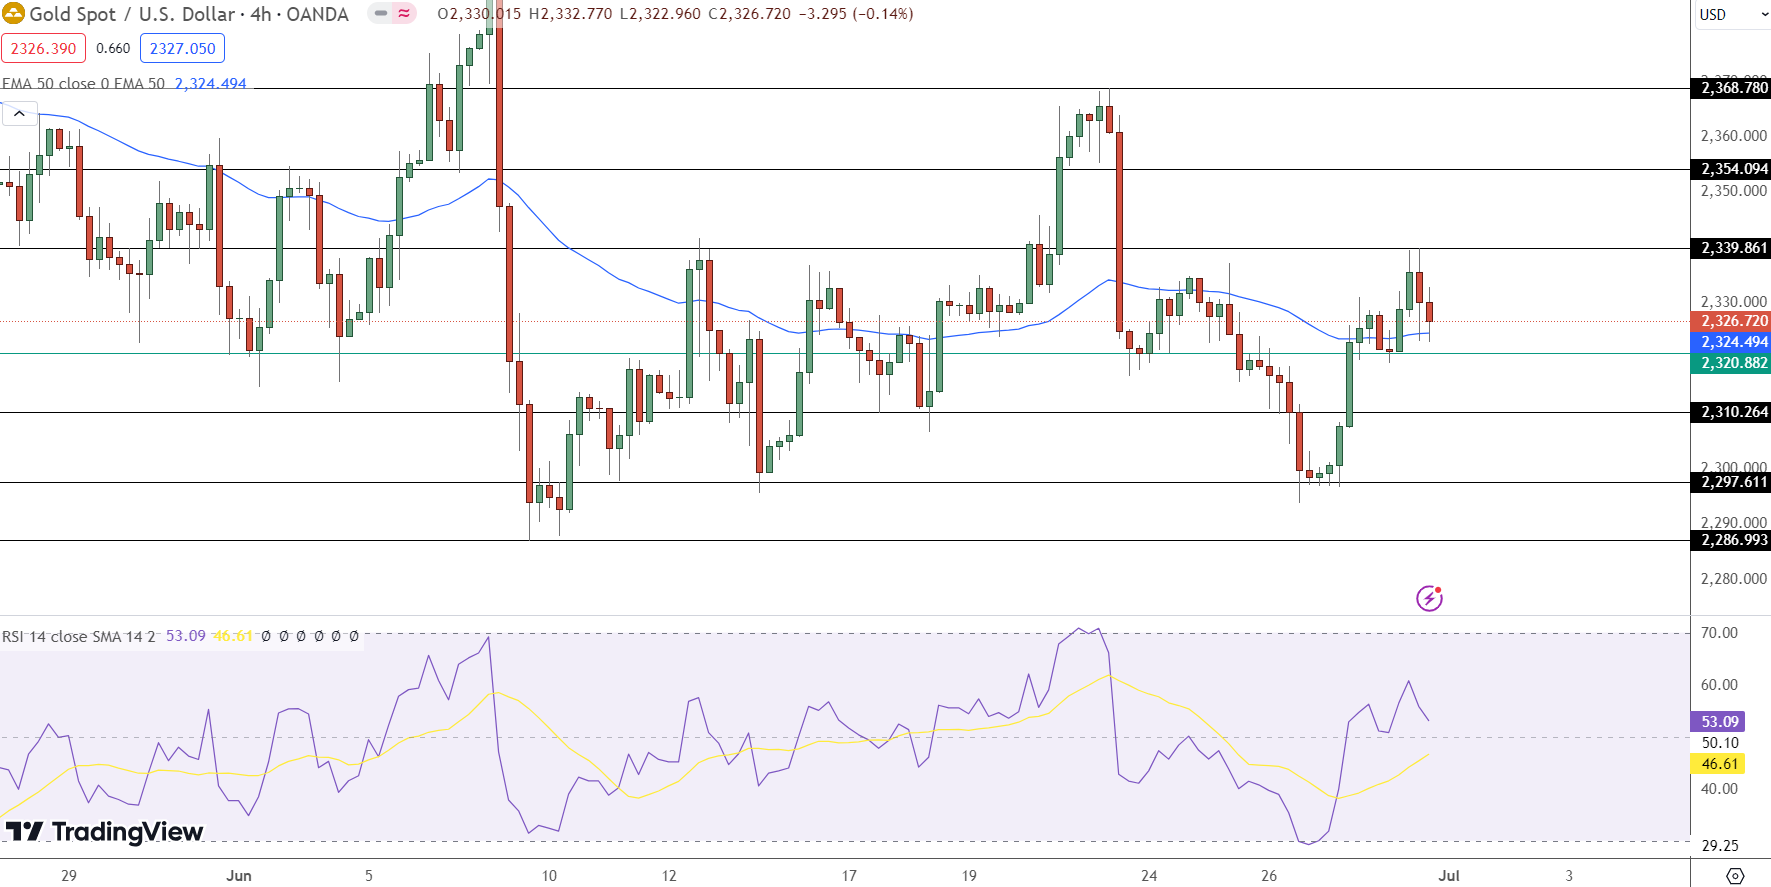
Gold prices have recently shown a downward trend, closing the week around $2,326 after hitting an intra-day low of $2,319. This decline can be attributed to several factors, including elevated U.S. Treasury yields and cautious investor sentiment ahead of upcoming economic data releases.

However, amidst these pressures, geopolitical tensions in the Middle East have provided some support to gold, underscoring its traditional role as a safe-haven asset during periods of uncertainty.
Impact of US Economic Indicators and Fed Comments on Gold Prices
On the US front, gold prices initially rose to a four-day high of $2,339 following an inflation report indicating progress towards lower inflation, sparking optimism for a potential Federal Reserve interest rate cut in 2024. However, prices retreated to $2,324, a 0.12% decline, as traders reacted to the US PCE Price Index for May meeting expectations and reflecting stable consumer confidence despite higher prices.
Concurrently, US Treasury yields climbed to 4.339%, exerting downward pressure on gold. The US Dollar Index maintained stability around 105.80, experiencing slight fluctuations throughout the session. Federal Reserve officials, including Richmond’s Thomas Barkin and San Francisco’s Mary Daly, expressed cautious views on inflation and economic growth, impacting market sentiment.
Therefore, the impact on gold prices was mixed. Initialy, they rose to $2,339 on hopeful Fed rate cut expectations but later fell to $2,324 as stable US consumer sentiment and higher Treasury yields weighed on investor confidence.
Geopolitical Tensions in the Middle East Could Limit Gold’s Losses
Despite the downward pressure on gold prices, escalating geopolitical tensions in the Middle East could curb further declines. Gold, renowned as a safe-haven asset, typically attracts investment during periods of geopolitical uncertainty.
In the past 24 hours, Gaza’s Health Ministry reported 40 Palestinians killed and 224 wounded. Israeli forces targeted a water distribution point in Gaza City, resulting in the deaths of four members of the al-Ghazi family, including a child.
UN spokesman Stephane Dujarric highlighted Israel’s recent ground offensive in Gaza City’s Shujayea neighbourhood, displacing at least 60,000 residents, while operations in southern Gaza’s al-Mawasi area displaced 5,000 people and led to numerous casualties.
The conflict has taken a toll, with 37,834 deaths and 86,858 injuries in Gaza since October 7.


Sidebar rates
Related Posts
