S&P 500 Ends Lower After New Record Highs, 15% Up Since Jan
Skerdian Meta•Friday, June 28, 2024•2 min read
The S&P 500 initially surged by 40 points to reach a record high of 5,523 points today, but reversed lower to end the last day of the week month, and Q2 down. However, it is up for the week, the month, Q1, and the H1 of 2024, with quite some decent gains.

This pullback can be attributed to several factors, including lower-than-expected US PCE inflation data, remarks from the Federal Reserve, month-end flows, and political developments.
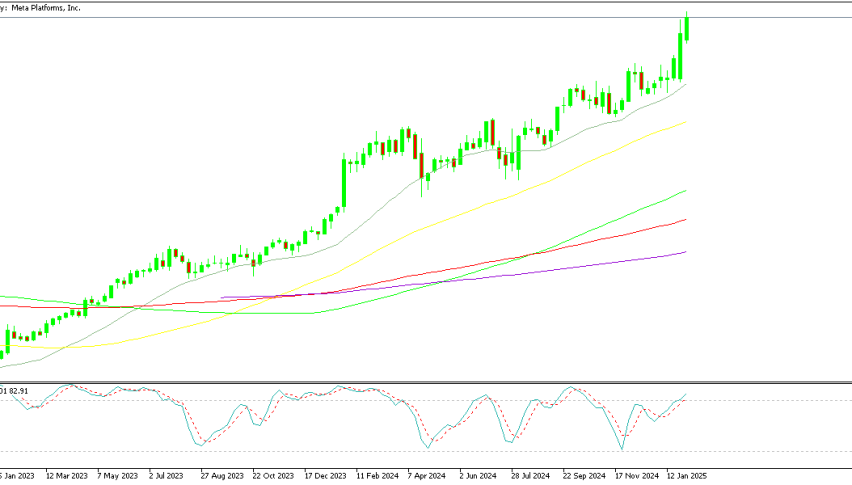
S&P 500 Chart Daily – Today’s Candlestick Looks Pretty Bearish

Despite closing the day down by 0.4%, the S&P 500 has posted a robust 14% gain for the first half of the year. However, today’s reversal from an all-time high is a cause for concern. Looking ahead, it’s worth noting that the first three trading days of July are historically some of the strongest of the year.
Closing Changes on Friday for S&P 500, Nasdaq, DJIA:
- S&P 500: down 0.4%
- Nasdaq: down 0.7%
- Russell 2000: up 0.1%
- DJIA: down 0.1%
- Toronto TSX Comp: down 0.5%
Weekly Performance for S&P 500, Nasdaq, DJIA:
- S&P 500: down 0.1%
- Dow Jones: down 0.1%
- Nasdaq: up 0.2%
Monthly Performance (June) for S&P 500, Nasdaq, DJIA:
- S&P 500: up 3.5%
- Dow Jones: up 1.1%
- Nasdaq: up 6.0%
Quarterly Performance (Q2) for S&P 500, Nasdaq, DJIA:
- S&P 500: up 3.9%
- Dow Jones: down 1.7%
- Nasdaq: up 8.3%
S&P 500’s Best Performers:
- $SMCI: +194% (Super Micro Computer Inc. benefited from increased demand in AI and high-performance computing sectors.)
- $NVDA: +152% (Nvidia’s growth driven by strong performance in the semiconductor market, particularly in GPUs for AI and gaming.)
- $VST: +120.5% (Vistra Corp. saw gains due to positive energy market trends.)
- $CEG: +73% (Constellation Energy had strong performance due to rising energy prices and demand.)
- $GE: +57% (General Electric benefited from improvements in its aviation and healthcare segments.)
S&P 500’s Worst Performers:
- $WBA: -53% (Walgreens Boots Alliance suffered from lower consumer spending and competitive pressures.)
- $LULU: -41% (Lululemon faced inventory challenges and weaker-than-expected earnings.)
- $INTC: -38% (Intel experienced setbacks in its manufacturing and competitive position in the semiconductor market.)
- $EPAM: -37.5% (EPAM Systems faced issues related to geopolitical risks and supply chain disruptions.)
- $ALB: -35% (Albemarle Corporation struggled due to fluctuating commodity prices and market demand for lithium.)
US Stock Index S&P 500 Live Chart
S&P500
Check out our free forex signals
Follow the top economic events on FX Leaders economic calendar
Trade better, discover more Forex Trading Strategies
Skerdian Meta
Lead Analyst
Skerdian Meta Lead Analyst.
Skerdian is a professional Forex trader and a market analyst. He has been actively engaged in market analysis for the past 11 years. Before becoming our head analyst, Skerdian served as a trader and market analyst in Saxo Bank's local branch, Aksioner. Skerdian specialized in experimenting with developing models and hands-on trading. Skerdian has a masters degree in finance and investment.
Related Articles

Comments
Subscribe
Login
Please login to comment
0 Comments
Oldest