– US GDP increased by 1.4%, matching analysts’ expectations. The USD Index fell 0.17%, making it the worst-performing currency of the day.
– US Weekly Unemployment Claims remain high but are consistent with previous expectations.
– Durable Goods Orders grew by 0.1%, providing support for the US Stock Market.
USA500

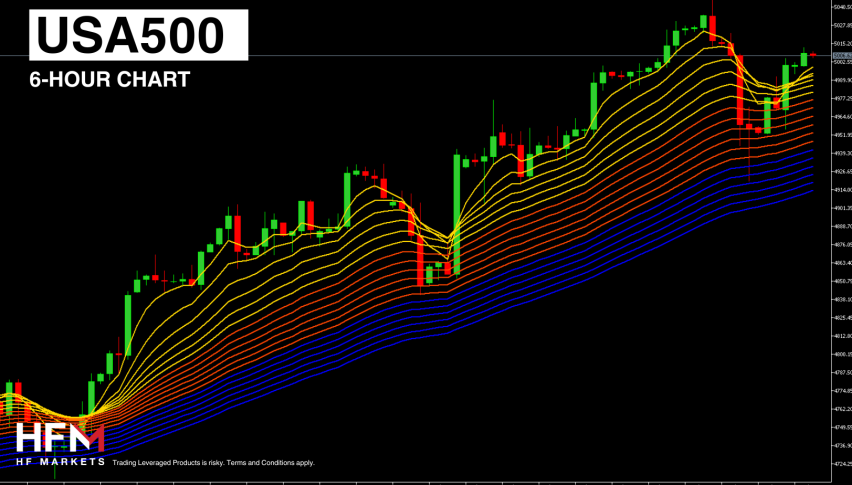
The US Stock Market rose after the release of the latest GDP, Durable Goods, and Unemployment Claims data. However, the medium-term outlook still suggests a sideways price movement. Investors are looking to gather more data ahead of the upcoming earnings season to strategically position their portfolios.
Key focus areas for investors include tomorrow’s Core PCE Price Index and the latest NFP Employment Change. Analysts predict the Core PCE Price Index will fall from 2.7% to 2.6%. If it doesn’t decline, the stock market may face pressure due to the lack of data indicating a rate adjustment. Currently, the market is pricing in a rate cut for September 2024. Many analysts believe the USA500 could be overpriced if this cut does not materialize.
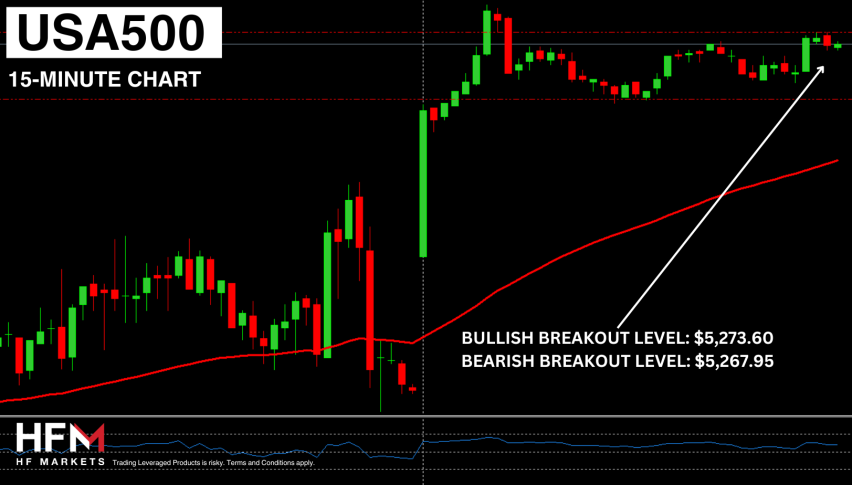
While the S&P 500 shows signs of bullish movement, there are indications of a wide price range. For instance, 52% of the top 25 most influential stocks are trading lower in pre-market hours, and the index remains below a recurring resistance level.
Meanwhile, the actions of the US Federal Reserve remain uncertain. Despite a slight decrease in the consumer price index from 3.4% to 3.3% in May, officials are still considering maintaining tight monetary policy for an extended period and possibly increasing borrowing costs if necessary. Upcoming economic data, including today’s GDP and Friday’s May personal consumption expenditures price index, could influence the Fed’s decisions.
Today’s economic data aligns with a bullish short-term outlook, indicating stability, economic growth, and no upward pressure on inflation. Most assets are increasing in value during the European Cash Open, signaling strong investor sentiment and higher risk appetite. Additionally, the VIX, a well-known sentiment index, is trading lower, which typically supports the stock market.
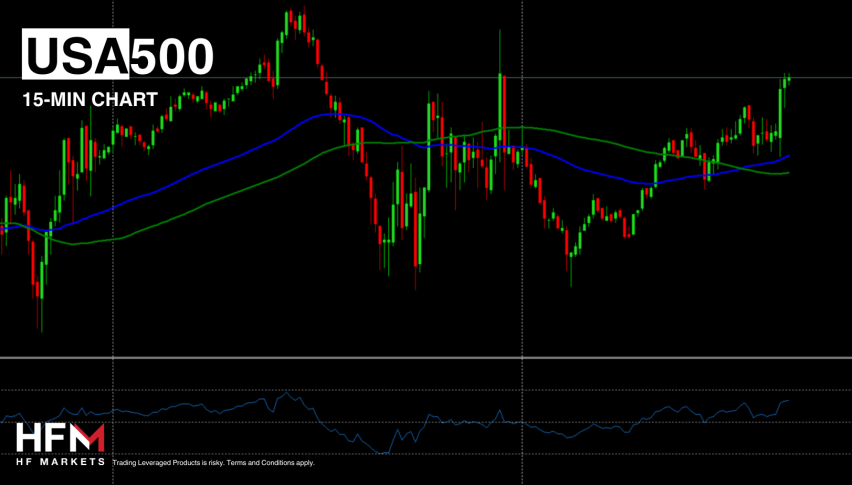
The main concern for investors is the resistance level at $5,492.10, yet the price continues to trade above the 75-Bar EMA, indicating a short-term upward trend.
- Check out our free forex signals
- Follow the top economic events on FX Leaders economic calendar
- Trade better, discover more Forex Trading Strategies
- Open a FREE Trading Account
Related Articles
Comments
Sidebar rates
Related Posts
