XRP Price Prediction: Nears Pivot Point at $0.52285 Amid Market Flux
As of today, XRP is trading at $0.52505, marking a slight decline of 0.17% on the four-hour chart. The cryptocurrency's price movement

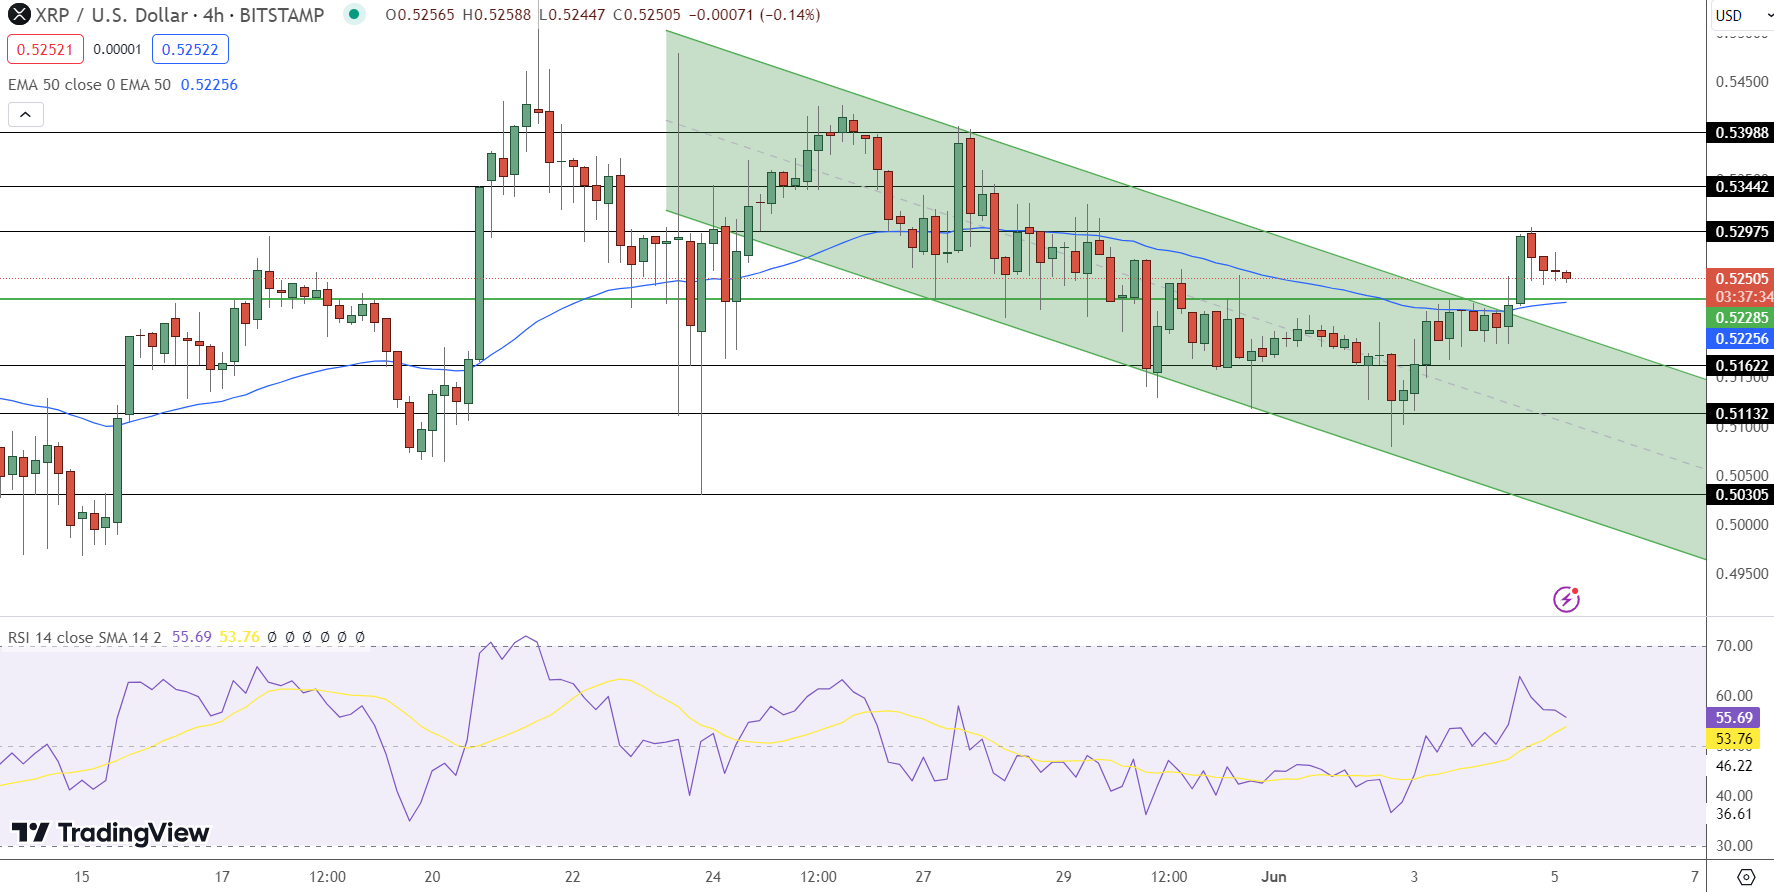
As of today, XRP is trading at $0.52505, marking a slight decline of 0.17% on the four-hour chart. The cryptocurrency’s price movement hovers around a critical juncture, slightly above its pivot point of $0.52285, which is a key indicator of potential future price movements.
Price Movements and Key Levels
XRP’s current trading price suggests a subtle balancing act between buyers and sellers in the market. The immediate resistance level is at $0.52975. Should the price break this level, it could head towards higher resistance at $0.53442, followed by $0.53988.
On the downside, immediate support is located at $0.51622. Further declines could see XRP testing the subsequent support levels at $0.51132 and then a more substantial floor at $0.50305.
Technical Indicators and Market Sentiment
The Relative Strength Index (RSI) stands at 55, indicating a neutral market sentiment with potential shifts towards bullish or bearish trends based on upcoming market dynamics.
The 50-Day Exponential Moving Average (EMA) at $0.52256 corroborates the pivot point, reinforcing its significance as a potential support level that could dictate short-term price movements.
Given the current technical setup, the market stance for XRP appears cautiously optimistic, as it trades just above the critical pivot point. A sustained move above this level could confirm the continuation of a bullish trend, while a drop below it might signal the onset of a stronger bearish phase.
Investors and traders should monitor these key levels closely, as a break in either direction could offer significant trading opportunities. The proximity of the current price to the pivot point suggests that XRP is at a potential turning point, making the next few trading sessions crucial for determining its short-term trajectory.
- Check out our free forex signals
- Follow the top economic events on FX Leaders economic calendar
- Trade better, discover more Forex Trading Strategies
- Open a FREE Trading Account
Related Articles
Comments
Sidebar rates
Related Posts
