5 Best Shares to Buy at the Moment
The five top shares to consider are Amazon (AMZN), Apple (AAPL), Alphabet (GOOGL), Powell Industries (POWL), and NVIDIA Corp (NVDA).
Investing in the stock market requires strategic analysis and timing to identify the best stocks. Currently, the five top shares to consider are Amazon (AMZN), Apple (AAPL), Alphabet (GOOGL), Powell Industries (POWL), and NVIDIA Corp (NVDA).

These stocks have demonstrated strong performance and growth potential, making them excellent investment opportunities. Amazon, for example, has increased by 27.28% over the past six months, while NVIDIA has surged by 95.80%.
Amazon (NASDAQ: AMZN)
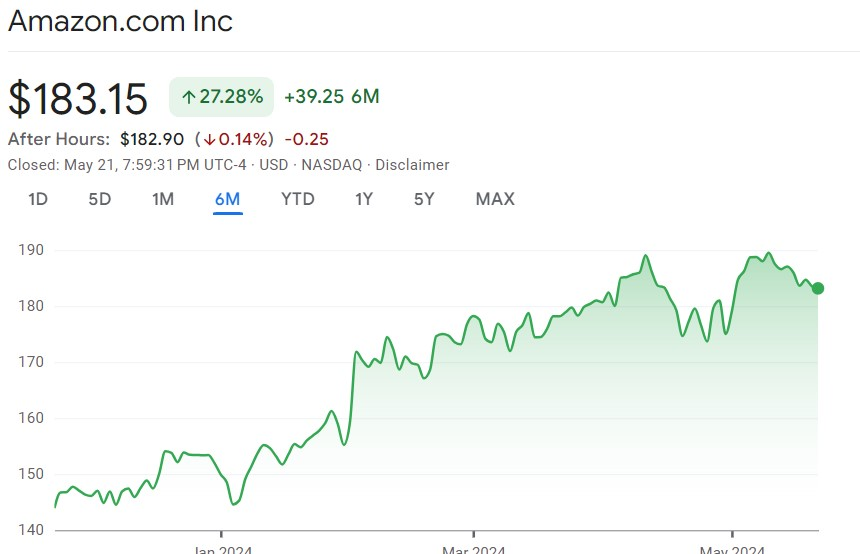
Amazon has demonstrated remarkable performance over the past six months, with its stock price increasing by 27.28%, reaching $183.15. This impressive growth reflects the company’s strong financial results and positive market sentiment.
Investors should carefully review the company’s financial statements to understand its financial health and future prospects.
Amazon’s revenue for March 2024 was $143.31 billion, a 12.53% increase year-over-year. The company’s net income surged by 228.85% to $10.43 billion, and earnings per share (EPS) rose by 216.13% to $0.98.
Additionally, Amazon’s EBITDA grew by 69.79% to $26.99 billion, indicating enhanced operational efficiency.
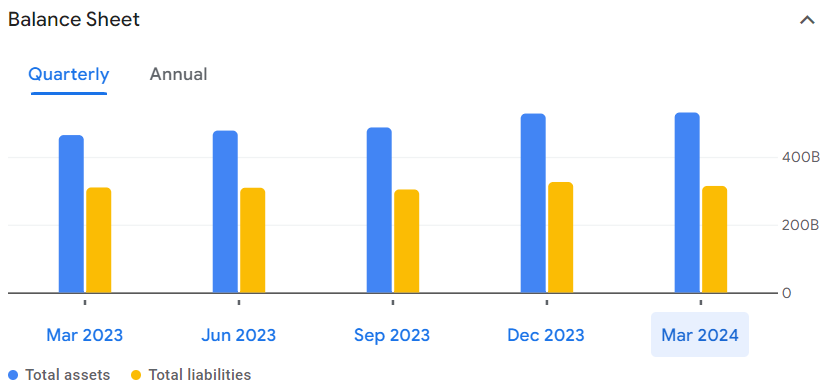
Balance Sheet Highlights:
- Cash and Short-term Investments: $85.07 billion (+32.09% YoY)
- Total Assets: $530.97 billion (+14.34% YoY)
- Total Liabilities: $314.31 billion (+1.44% YoY)
- Total Equity: $216.66 billion
Amazon’s strong cash reserves and significant net income growth highlight its excellent financial health. The company’s increased profitability is evident from its net profit margin, which improved to 7.28%, up 192.37% year-over-year.
With a market capitalization of $1.91 trillion and a P/E ratio of 51.44, Amazon continues to be a dominant player in the market. The average trading volume stands at 43.44 million shares, reflecting high investor interest.
Summary: Stock Price
- Stock Price Increase: +27.28% to $183.15
- Revenue: $143.31 billion (+12.53% YoY)
- Net Income: $10.43 billion (+228.85% YoY)
- EPS: $0.98 (+216.13% YoY)
- Market Cap: $1.91 trillion
Amazon’s robust financial performance, including a significant increase in revenue, net income, and EPS, along with strong cash reserves and market dominance, makes it a highly attractive investment.
For more detailed information, visit aboutamazon.com.
Apple (NASDAQ: AAPL)
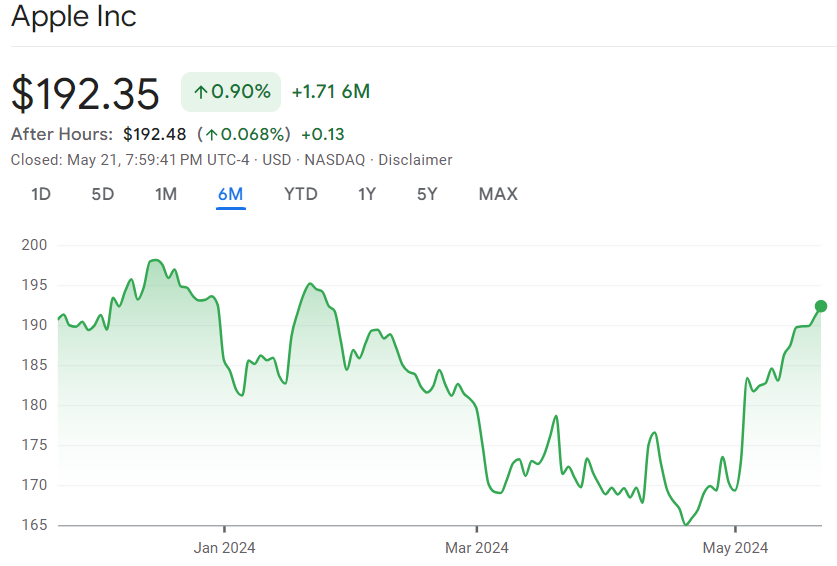
Over the past six months, Apple Inc. (NASDAQ: AAPL) has seen a modest increase in its stock price, rising by 0.90% to reach $192.35. Under Tim Cook’s leadership, Apple continues to innovate with new product launches and expansions into new markets.
Apple’s consistent dividend payments also make it an attractive option for investors seeking regular income.
Key Performance Highlights:
- Stock Price Increase: Apple’s stock rose from $190.64 to $192.35, marking a 0.90% gain. This performance is reflective of the company’s solid market presence and strategic advancements.
- Market Cap: Apple’s market capitalization stands at $2.95 trillion, reaffirming its status as one of the most valuable companies in the world.
- P/E Ratio: The price-to-earnings (P/E) ratio is at 29.91, indicating strong investor confidence in the company’s profitability.

Apple Quaterly Balance Sheet (Source: Google Finance)
Financial and Operational Metrics: Company’s Financial Statements
- Revenue: For March 2024, Apple reported revenue of $90.75 billion, a slight decrease of 4.31% year-over-year.
- Net Income: Net income stood at $23.64 billion, down 2.17% from the previous year, with a net profit margin of 26.04%.
- Earnings per Share (EPS): EPS was $1.53, reflecting a small increase of 0.66%.
- Cash and Investments: Apple holds $67.15 billion in cash and short-term investments, up 20.19%, showcasing its strong liquidity position.
Summary:
Apple’s steady performance and strong financial health make it a reliable investment. Despite a slight dip in revenue, its strong cash reserves and continued innovation under Tim Cook’s leadership suggest that Apple remains a solid choice for long-term investors. For more details, visit apple.com.
Alphabet (NASDAQ: GOOGL)
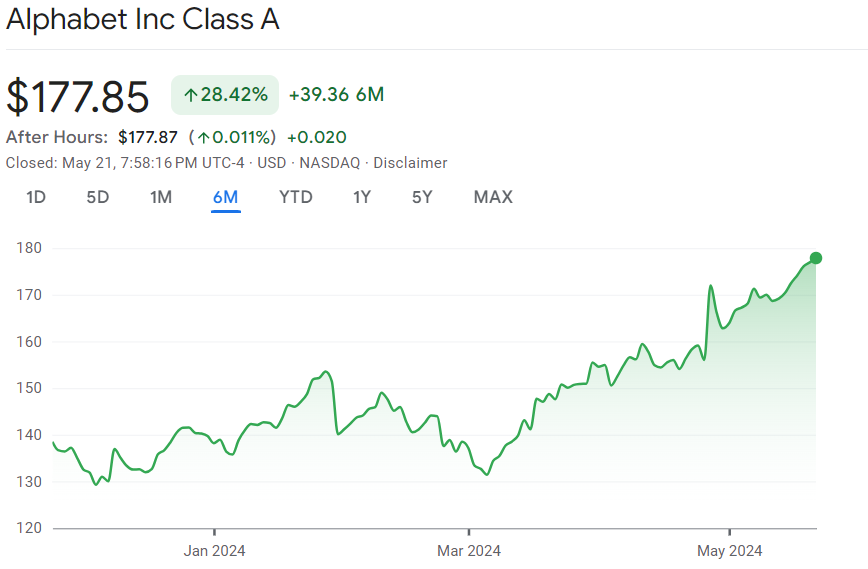
Alphabet Inc. (NASDAQ: GOOGL) has shown significant growth over the past six months, with its stock price rising by 28.42%, reaching $177.85. This robust performance is underpinned by strong financial results and positive market sentiment.
Alphabet’s strong free cash flow further underscores its profitability and financial stability.
For March 2024, Alphabet reported revenue of $80.54 billion, a 15.41% increase year-over-year. The company’s net income surged by 57.21% to $23.66 billion, and earnings per share (EPS) increased by 61.54% to $1.89.
Additionally, Alphabet managed to reduce its operating expenses by 4.45% to $20.79 billion, indicating improved operational efficiency.
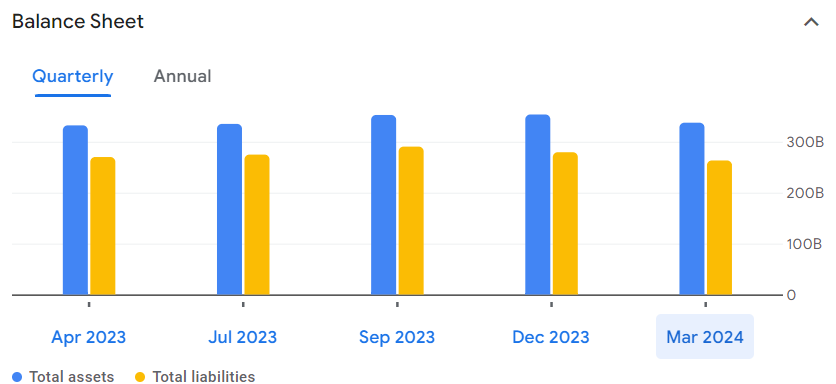
Balance Sheet Highlights:
- Cash and Short-term Investments: $108.09 billion (-6.09% YoY)
- Total Assets: $407.35 billion (+10.25% YoY)
- Total Liabilities: $114.51 billion (+5.44% YoY)
- Total Equity: $292.84 billion
Alphabet’s strong cash reserves, despite a slight decrease, and significant net income growth highlight its solid financial health. The company’s increased profitability is evident from its net profit margin, which improved to 29.38%, up 36.21% year-over-year.
With a market capitalization of $2.21 trillion and a P/E ratio of 27.73, Alphabet continues to be a major player in the tech industry. The average trading volume is 28.85 million shares, reflecting substantial investor interest.
Summary: Growth Stocks
- Stock Price Increase: +28.42% to $177.85
- Revenue: $80.54 billion (+15.41% YoY)
- Net Income: $23.66 billion (+57.21% YoY)
- EPS: $1.89 (+61.54% YoY)
- Market Cap: $2.21 trillion
Alphabet’s impressive financial performance, including a significant increase in revenue, net income, and EPS, along with a solid balance sheet and market dominance, makes it a highly attractive investment.
The company’s continuous innovation in AI, digital advertising, and cloud computing further strengthens its growth prospects, presenting a compelling opportunity for long-term investors.
Powell Industries, Inc. (NASDAQ: POWL)
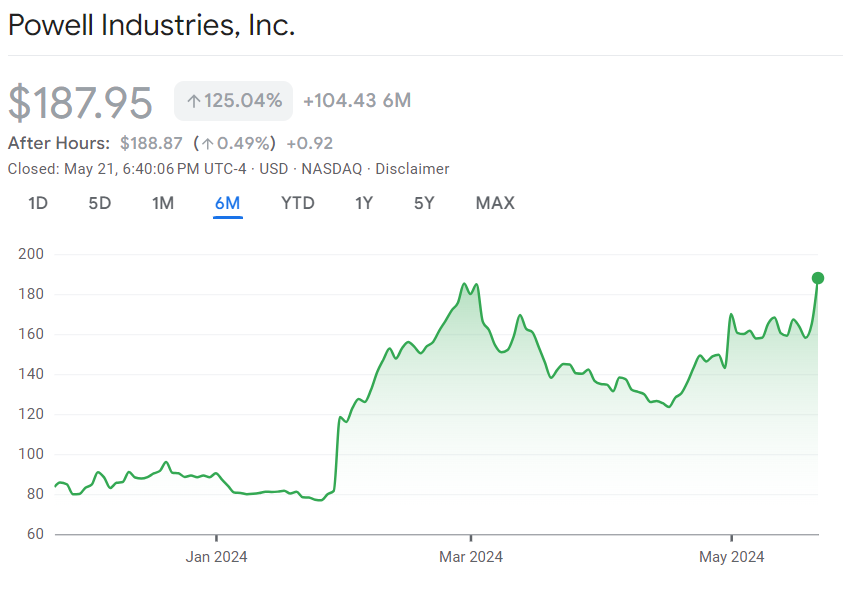
Powell Industries, Inc. (NASDAQ: POWL) has exhibited extraordinary growth over the past six months, with its stock price surging by 125.04% to $187.95. This impressive performance is supported by robust financial results and strong market dynamics.
Powell Industries is considered one of the promising growth stocks due to its impressive financial performance and market dynamics.
For the quarter ending in March 2024, Powell Industries reported revenue of $255.11 million, a substantial 48.80% increase year-over-year. The company’s net income skyrocketed by 295.23% to $33.49 million, while earnings per share (EPS) climbed by 292.86% to $2.75.
Additionally, Powell Industries’ EBITDA rose by 236.43% to $41.21 million, showcasing significant improvements in profitability.
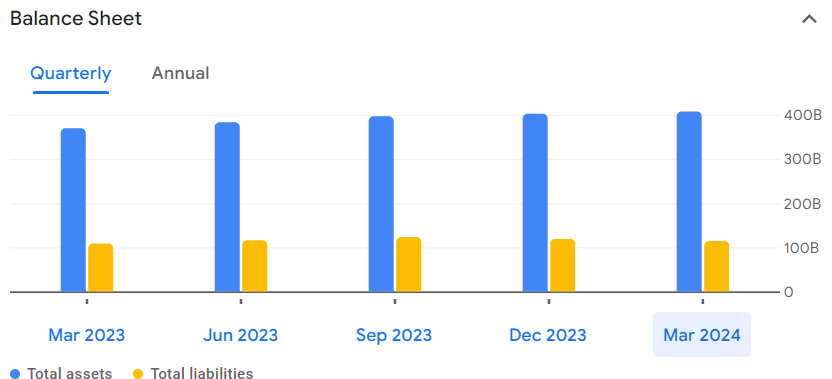
Balance Sheet Highlights:
- Cash and Short-term Investments: $365.34 million (+123.96% YoY)
- Total Assets: $849.62 million (+44.72% YoY)
- Total Liabilities: $455.83 million (+62.04% YoY)
- Total Equity: $393.79 million
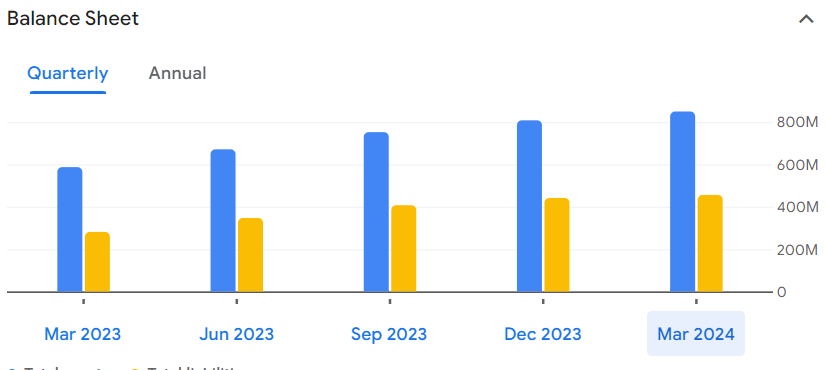
Powell Industries’ strong cash reserves and remarkable net income growth highlight its solid financial position. The company’s net profit margin improved to 13.13%, up 165.79% year-over-year, reflecting enhanced operational efficiency.
With a market capitalization of $2.25 billion and a P/E ratio of 22.32, Powell Industries continues to attract significant investor interest. The average trading volume is 304.90K shares, indicating robust market activity.
Summary: Dividend Payments
- Stock Price Increase: +125.04% to $187.95
- Revenue: $255.11 million (+48.80% YoY)
- Net Income: $33.49 million (+295.23% YoY)
- EPS: $2.75 (+292.86% YoY)
- Market Cap: $2.25 billion
Powell Industries’ exceptional financial performance, including substantial increases in revenue, net income, and EPS, coupled with strong cash reserves and operational efficiency, makes it a highly attractive investment.
The company’s continuous innovation and strategic growth initiatives further enhance its potential, presenting a compelling opportunity for long-term investors.
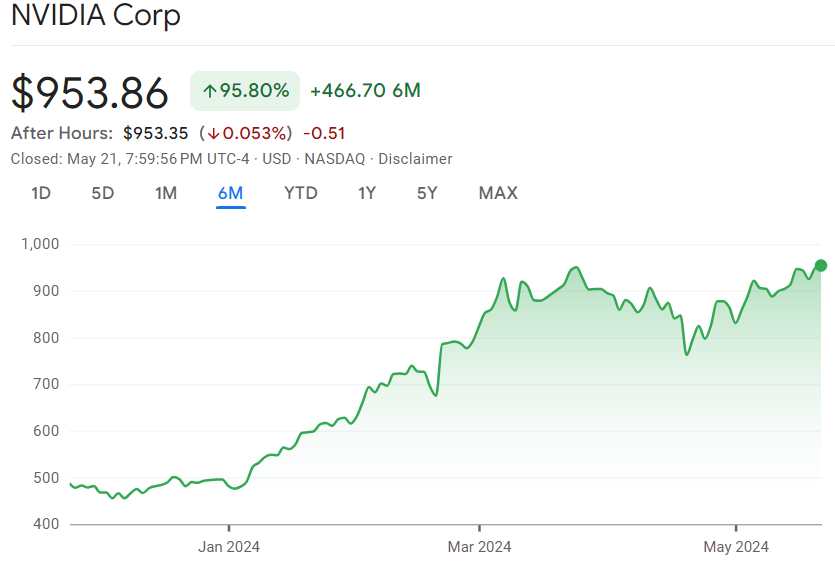
NVIDIA Corp (NASDAQ: NVDA)
NVIDIA Corp (NASDAQ: NVDA) has exhibited outstanding growth over the past six months, with its stock price rising by 95.80% to $953.86. The company’s strong financial results and dominant position in the tech sector are what are driving this remarkable performance.
NVIDIA’s strong performance, despite market volatility, demonstrates its resilience and robust business model.
For the quarter ending in January 2024, NVIDIA reported revenue of $22.10 billion, a staggering 265.28% increase year-over-year. The company’s net income soared by 768.81% to $12.29 billion, while earnings per share (EPS) increased by 486.36% to $5.16.
Additionally, NVIDIA’s EBITDA rose by 732.40% to $14.00 billion, showcasing its enhanced profitability.
Balance Sheet Highlights:
- Cash and Short-term Investments: $25.98 billion (+95.43% YoY)
- Total Assets: $65.73 billion (+59.60% YoY)
- Total Liabilities: $22.75 billion (+19.23% YoY)
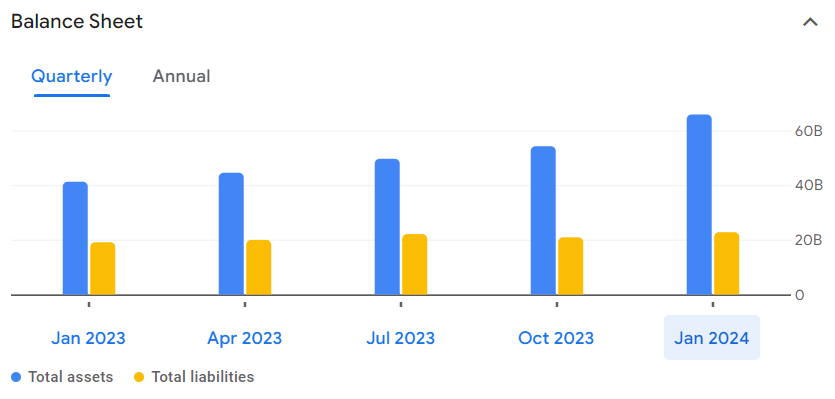
NVIDIA’s strong cash reserves and substantial net income growth highlight its excellent financial health. The company’s net profit margin improved to 55.58%, up 137.83% year-over-year, reflecting significant operational efficiency.
With a market capitalization of $2.35 trillion and a P/E ratio of 79.94, NVIDIA continues to be a dominant force in the tech sector. The average trading volume is 42.99 million shares, indicating high investor interest.
Summary:
- Stock Price Increase: +95.80% to $953.86
- Revenue: $22.10 billion (+265.28% YoY)
- Net Income: $12.29 billion (+768.81% YoY)
- EPS: $5.16 (+486.36% YoY)
- Market Cap: $2.35 trillion
NVIDIA’s exceptional financial performance, marked by substantial increases in revenue, net income, and EPS, along with strong cash reserves and operational efficiency, makes it a highly attractive investment.
The company’s continuous innovation in AI, gaming, and data centres further enhances its growth prospects, presenting a compelling opportunity for long-term investors.
Conclusion
In conclusion, the stock market offers several attractive stocks to buy, with Amazon, Apple, Alphabet, Powell Industries, and NVIDIA standing out as the top picks. These companies have shown strong financial performance and significant growth potential.
Amazon and NVIDIA, in particular, have demonstrated remarkable stock price increases of 27.28% and 95.80%, respectively, over the past six months.
Investing in the stock market, especially in these stocks, can provide a solid foundation for a diversified and profitable investment portfolio.
- Check out our free forex signals
- Follow the top economic events on FX Leaders economic calendar
- Trade better, discover more Forex Trading Strategies
- Open a FREE Trading Account