USD/BRL: Brazilian Real Continues Rally Against the Dollar as Improved GDP Forecast Released
The market continued to push the dollar lower today for a third consecutive day. With geopolitical risks in the Middle East fading and a positive economic forecast the tail winds for the real.
The market continued to push the dollar lower today for a third consecutive day. With geopolitical risks in the Middle East fading and a positive economic forecast the tail winds for the real.
Today the BCB (Banco Central do Brazil) published its Focus Bulletin reporting it expected the country’s GDP to grow by 2.02% in 2024. However, the economic forecast was stifled by inflation concerns.
The BCB president, Roberto Campos Neto, said yesterday that there could be a possible delay in the rate of interest rate cuts due to the inflation outlook. The central bank chief was at the event organized by Legend Capital fund, where he discussed the complexities of managing global inflation.
On May 1 the Fed will have its monetary policy committee meeting followed a week later by the same meeting for the BCB. The market has it very clear that the Fed will keep rates on hold this meeting.
And at the same time expectations for the next rate cut are being pushed further into the second half of the year.
On the other hand, most forecasts for the BCB meeting predict another cut in the Selic, BCB base rate, by 0.50%. That would be the second cut in rates in a row after last March 20, when the central bank cut rates to 10.75% from 11.25%.
A cut in rates during the next meeting may well be discounted by the market, but the rate differential will get tighter for longer as the Fed looks likely to hold for longer before cutting rates again.
This may penalize the real in the coming months, at least until there is a perception of rate cuts coming soon in the US.
Technical View
The chart for USD/BRL shows a market in a bull trend undergoing a recent correction from its high on April 19, at 5.2911. The current bear market seems exactly that, a temporary change in trend within a main bull trend.
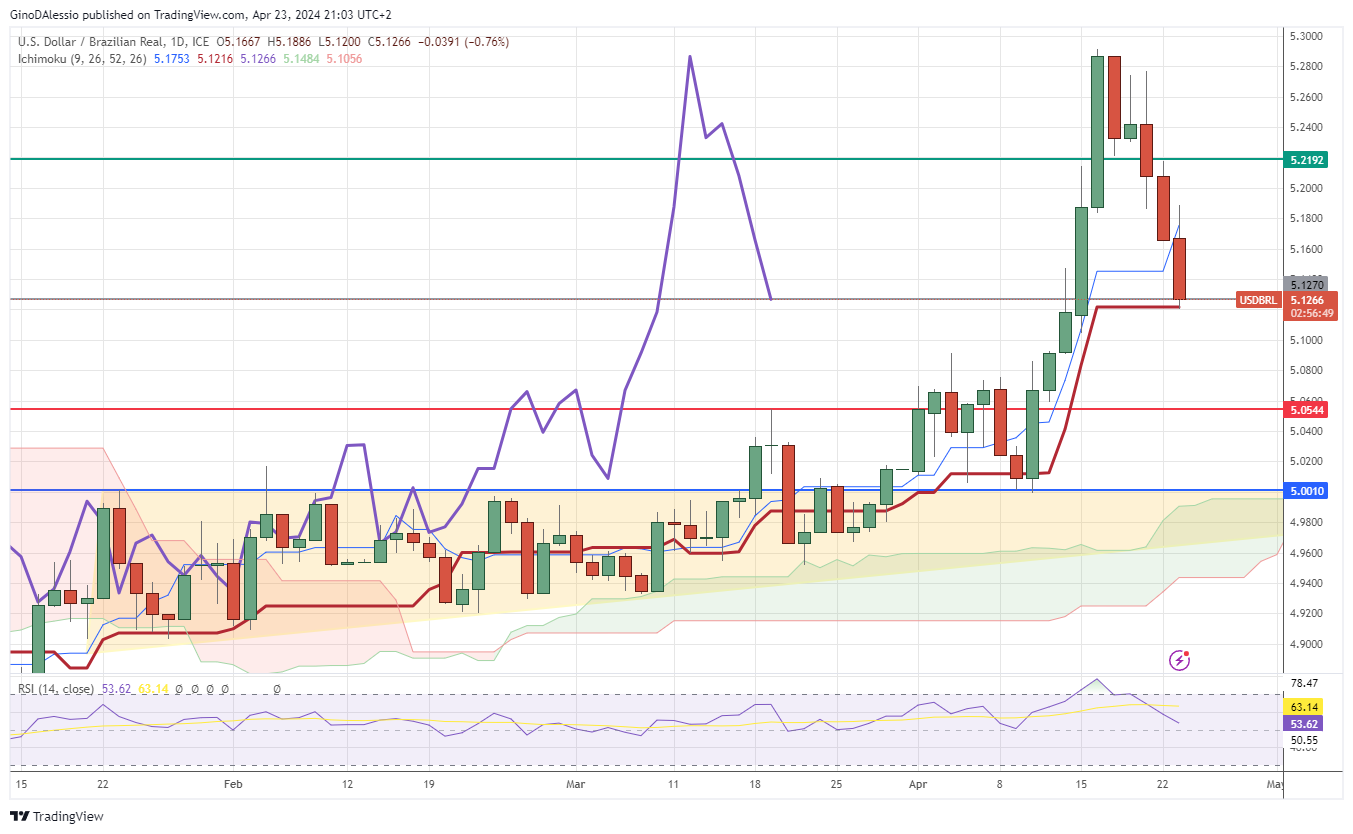
The market is above the Ichimoku cloud, and for now the RSI is also above 50. Today’s candle is testing the support (grey line), set in May 2023. It’s also testing the Kijun line (crimson line), which also acts as a support or resistance.
I believe if today’s close is above the Kijun line we’ll likely see a rebound higher over the remaining week. While a break below both the grey line and the kijun line should lead to the market trading lower.
The next support, in this case, would be at 5.0544 (red line), a level set by various failed attempts to break above or below it on several occasions over the past 2 years. Whereas a rebound from here would find resistance at 5.2192, which is a level set from a previous high in October 2023.
- Check out our free forex signals
- Follow the top economic events on FX Leaders economic calendar
- Trade better, discover more Forex Trading Strategies
- Open a FREE Trading Account

