AUD/USD Below 2nd support After China’s GDP, Retail Sales
The USD to AUD rate continues to move up as AUD/USD falls down after the Chinese GDP and retail sales report released today.

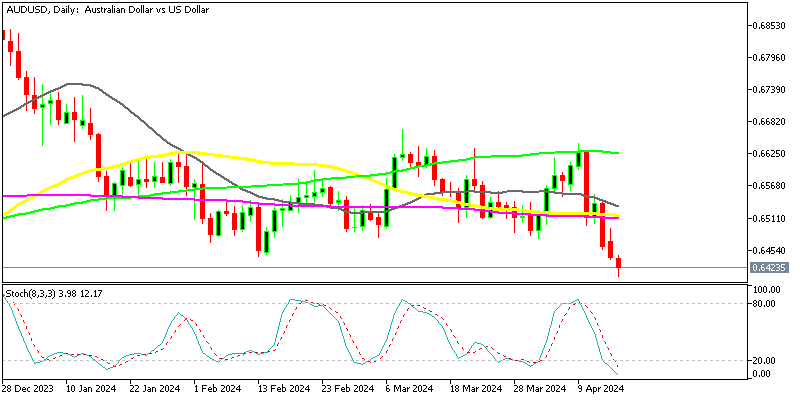
The USD to AUD rate continues to move up as AUD/USD falls down. The Australian dollar experienced a modest recovery from its recent eight-week low against the US Dollar (USD) on Friday, reaching a high of around 0.6640s. However, this upward movement was short-lived as the pair encountered resistance near the 100-period Simple Moving Average (SMA) represented by the green line on the chart.
AUD/USD Chart Daily – The 100 SMA Held As Resistance
After failing at this resistance, AUD/USD reversed its gains and dropped below the critical support level of $0.65, signaling a potential shift in the direction of future trading. Moreover, the pair breached the second support zone at 0.6450, indicating further downside momentum. The turbulent geopolitical situation in the Middle East has contributed to the uncertainty surrounding currency prices, adding to the volatility of the AUD/USD pair.
China GDP Report
China’s Q1 2024 GDP growth came in at 5.3% year-on-year, surpassing expectations of +5.0%, and up from the previous reading of 5.2%. Quarter-on-quarter GDP growth was reported at +1.6%, higher than the previous figure of +1.0%. However, March industrial output grew by 4.5% year-on-year, falling short of expectations of +5.4%.
Retail sales in March also missed expectations, rising by 3.1% compared to the anticipated 4.5%. Property investment year-to-date (YTD) saw a decline of 9.5% year-on-year, slightly more than the expected -9.2%, and up from the previous -9.0%. Residential property sales YTD decreased by 30.7% year-on-year, showing a slight improvement from the previous -32.7%.
Industrial production YTD increased by 6.1% year-on-year, slightly exceeding expectations of 6.0%, but down from the previous 7.0%. Retail sales YTD rose by 4.7% year-on-year, a decrease from the previous +5.5%.
AUD/USD Live Chart
- Check out our free forex signals
- Follow the top economic events on FX Leaders economic calendar
- Trade better, discover more Forex Trading Strategies
- Open a FREE Trading Account


