XAU/USD: Gold Struggles to Find New Highs After the Drop from Friday
Gold remains in a negative territory compared to yesterday’s larger-than-usual session range, while geopolitical concerns add some fuel to


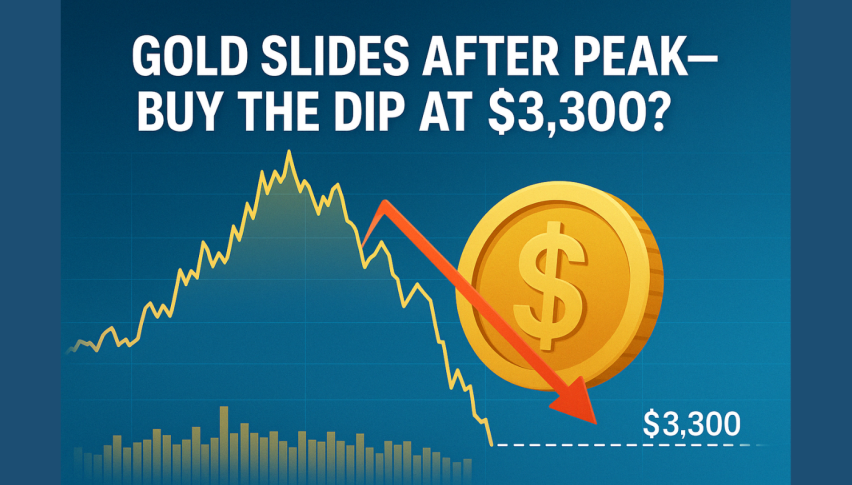
Gold remains in a negative territory compared to yesterday’s larger-than-usual session range, while geopolitical concerns add some fuel to the bullish trend.
Iran’s attack on Israel over the weekend has sent some investors looking for their favorite safe haven asset again. The market reached a new all-time high on Friday, but immediately retraced from that level to close in the red.
The last two months has seen a sharp rally in gold prices mainly thanks to central bank buying. Central banks from China and Russia have been buying gold regularly since 2010. The trend has continued with other central banks adding to their reserves in 2023.
These countries include India and Turkey, as reported by The World Gold Council in March. The report also showed that Turkey added 12 tons and China added 10 tons in 2023. I often wonder if the talk of a common gold-backed trade currency among the BRICS countries is closer than might be thought.
The constant and steady gold buying from BRICS nations could be explained as preparations for the touted gold-backed currency. Something that’s particularly important is the fact that central banks are usually net buyers as a group. And gold acquired tends to stay on reserve for long periods of time.
Having said that, it would seem my current gold price forecast is bullish, and long-term it is. However, we may be seeing a delay in interest rate cuts, which would weigh on prices reaching new highs.
Economic growth in the US seems solid, and jobs growth more than sufficient, so there may be a bit more to wait for the Fed’s pivot point. For now, the markets are banking on having to wait longer, in fact the US dollar is rising again against most currencies.
Technical View
The weekly chart below for XAU/USD shows a strong bullish trend, where the latest leg started at the end of February. However, we have two fairly important technical elements, especially as we’re considering the weekly time frame.

The previous week’s candle formed an upside-down hammer, which usually indicates a correction point. The correction may be longer or shorter, but that would be something that remains to be seen.
The second, but just as important, is the level of RSI over 70, at 78.9. On the weekly chart it’s fairly rare to see the RSI above 70. So, the conjunction of the two technicals indicates that we’re likely to experience some retracement in price.
If the correction were to take place we can expect the next support at $2,238 (red line). This level is the 23.6% retracement line in the Fibonacci Retracement tool. As we’re on the weekly chart it’s likely that such a correction would take a few weeks to complete.
- Check out our free forex signals
- Follow the top economic events on FX Leaders economic calendar
- Trade better, discover more Forex Trading Strategies
- Open a FREE Trading Account


