USD/CAD Breaks Above the Bullish Channel As Uptrend Escalates
There has been an increased weakness recently in the CAD to USD ratio, sending USD/CAD 2 cents higher last week to 1.3787.

There has been an increased weakness recently in the CAD to USD ratio, sending USD/CAD 2 cents higher last week to 1.3787. Buyers rushed in after the hot US CPI report and dovish Bank of Canada remarks, sending this pair above the bullish channel that started in late January.
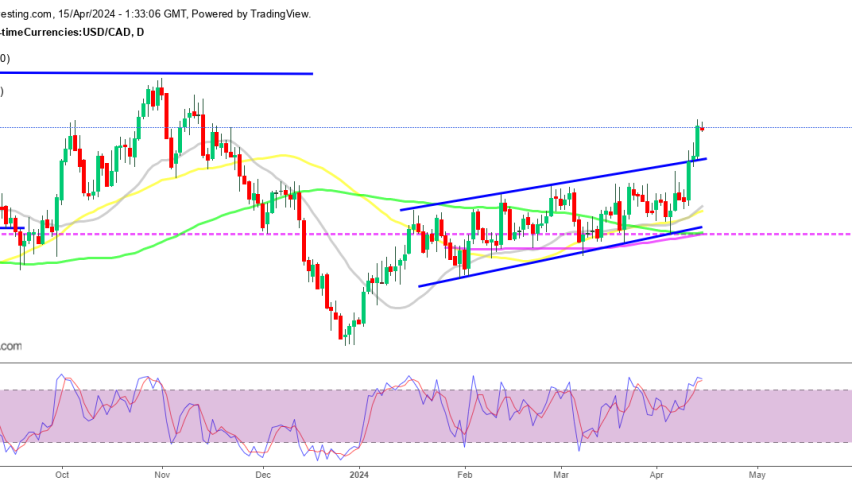
USD/CAD Chart Daily – The Top of the Channel Should Turn Into Resistance

USD/CAD has been on a bullish channel for more than 2 months, increasing around 3 cents until the top of the channel. Then the resistance line was broken and the price surged 100 pips higher on Wednesday, driven by a strong CPI inflation report from the US. The US Dollar Index (DXY) surpassed the resistance at 105 points for the first time since November. This signals a significant shift in sentiment towards the US dollar, indicating increased strength and bullish momentum.
The Bank of Canada (BoC) maintained its benchmark interest rate at 5.00% last week, in line with expectations. However, there was a notable change in the statement issued by the central bank. The BoC adjusted a phrase in the statement, indicating reduced concern about inflation. This change implies that if the current trend in inflation persists, a rate cut in June is a possibility, adding further strength to this pair.
Today we had the US retail sales report for March and the Empire State Manufacturing Index
In February, Canadian manufacturing sales increased by 0.7% to $71.6 billion, in line with expectations. This growth was observed across 13 out of 21 subsectors. Key contributors to the rise include:
- Petroleum and coal products, which saw a notable increase of 4.3%.
- Electrical equipment, appliance, and component products, experiencing a substantial surge of 12.6%.
However, the chemical subsector experienced a significant decline, with sales dropping by 5.5%. Sales in constant dollars showed a marginal increase of 0.1%.
Additionally, the Industrial Product Price Index also rose by 0.7%.
Inventory data for the same period revealed the following:
- Total inventories in Canada decreased by 0.7% to $120.6 billion in February, marking the third consecutive monthly decline. This decrease was mainly due to lower inventories in the chemicals and petroleum and coal products sectors.
- The inventory-to-sales ratio decreased from 1.71 in January to 1.68 in February, indicating a quicker turnover of inventory relative to sales.
- Unfilled orders in the manufacturing sector increased by 0.8% to $105.1 billion, with aerospace products and parts orders up by 1.2%.
- The capacity utilization rate for the manufacturing sector rose from 77.0% in January to 78.1% in February. Increases in capacity utilization were noted in several subsectors, including machinery, transportation equipment, and food.
USD/CAD Live Chart
- Check out our free forex signals
- Follow the top economic events on FX Leaders economic calendar
- Trade better, discover more Forex Trading Strategies
- Open a FREE Trading Account


