USD/CLP: Continues Higher on Strong US Data, Peso Loses Ground Despite Economic Growth

The Chilean peso continued to weaken against the dollar today, even with stronger than expected economic data.
The Central Bank of Chile (BCC) released the IMACEC, an indicator of key production sectors accounting for around 90% of GDP. The number released was 4.5% compared to last month’s 2.5%.
And as you can see from the chart below, it was a sharp increase compared to the previous readings going back over a year.

Despite the sharp increase in Chile’s economic activity, it wasn’t enough to keep the peso higher. Shortly after the data from Chile, we got the data from the US for ISM Manufacturing PMI. In this case there was also a positive surprise at 50.3 compared to an expected 48.4.
Perhaps more importantly, the index showed economic expansion for the first time since November 2022. This type of news is typically bullish for any currency. But in the current scenario it is even more so as the market reads that the Federal Reserve will likely be less keen on cutting rates quickly.
While the BCC cut rates a its previous meeting on January 31, and is expected to do so again at its next meeting tomorrow April 2. The last rate cut was from 8.25% to 7.25%, and the market consensus is for another cut of 75bp to 6.50%.
So, the picture here looks bleak for the local currency as the perception changes to a delay in rate cuts in the US, while the spread between the 2 rates tightens in favor of the US dollar.
Technical View
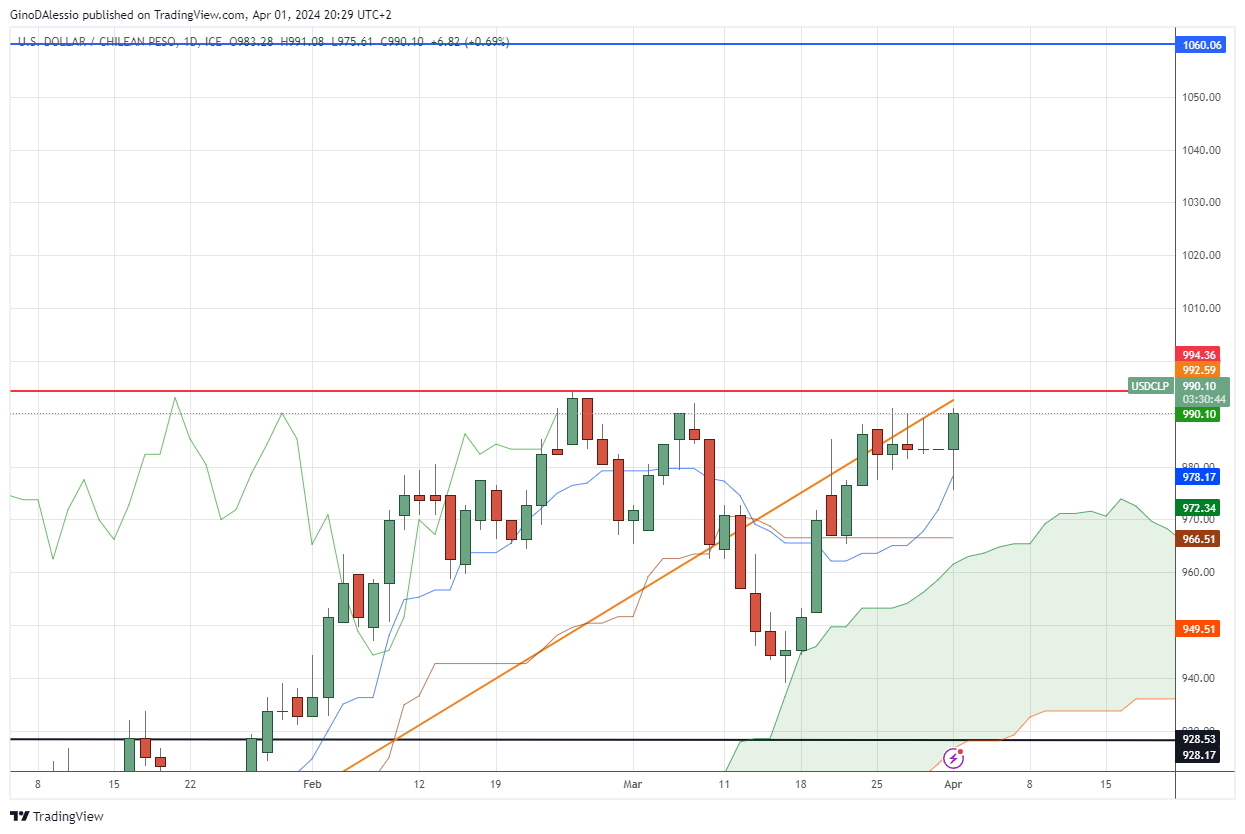
The day chart below for the USD/CLP shows the market getting closer to a tough resistance level (red line) set multiple times in the past. This area is also a significant psychological level, being close to the big figure of 1,000.

It also coincides with the trend line (orange) that was broken during the correction that tested the Ichimoku cloud in mid-March. So, we’re at a zone that will meet a lot of resistance and may be tested various times before there’s a breakout.
If the level does get broken, and by that I mean a close above 1,000 then we are probably going to test the next target which is the all-time-high. The maximum FX rate for this pair was reached back in July 2022 at 1.060.10 (blue line).
Should the market fail to break above the 1,000 level, we can expect a retracement to test the Ichimoku cloud again. In this case the support level would be between the top side of the cloud and the support line from previous dips in February and March, so between 972 and 965.


