Selling the retreat in XAU/USD As Gold Price Ticks Lower
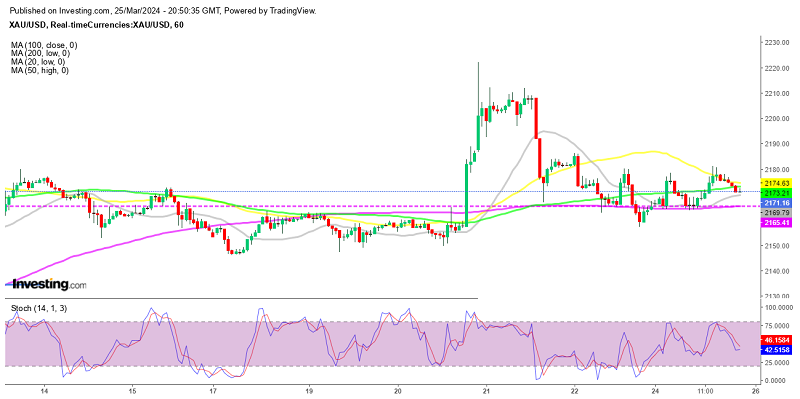
The Gold price surged to new record highs last week, although it retreated quickly and has been trading below $2,200 since then. This seems like a consolidation period, with XAU/USD bouncing in a range with the 200 SMA (purple) at the bottom on the H1 chart, while at the top side, some sort of resistance zone has formed around $2,180.
Gold Chart H1 – The 50 SMA Pushing XAU Lower
Last week, GOLD initially surged to a new record high after the FED decision which was taken as dovish initially, but then started to decline as US data surpassed expectations. Despite higher-than-expected US jobless claims, the overall picture painted by US PMIs indicates a rebound in economic activity, albeit with some inflation concerns.
Looking ahead in the coming months, XAU/USD is expected to remain supported as central banks enter an easing cycle. However, in the short term, positive US data is putting pressure on the market as it suggests fewer rate cuts may be needed than previously anticipated.
The 1-hour chart indicates rangebound price action, with the price finding support around the 2160 level. It’s important to monitor the swing high at 2,186 closely, as a breakout above this level could signal a reversal of the trend and prompt buyers to increase their bets on a rally to a new record high.
Conversely, sellers are likely to target the 2,180 level to position themselves for a break below the 2,150 support, potentially offering a more favorable risk-reward scenario for them. We decided to open a sell Gold signal at the 50 SMA (yellow) which acted as resistance and it is going alright now as this moving average keeps pushing the price of Gold lower.


