Ethereum (ETH) Navigates Post-Bitcoin Correction: Key Points for Traders Today
Ethereum (ETH) is clinging to the $3,500 mark after a 4.5% price drop in the past 24 hours. This decline mirrors a broader market correction following Bitcoin’s recent surge to a new all-time high and subsequent dip to $63,000. As traders navigate this uncertain environment, here are some crucial factors to consider before trading ETH today:
1. Delayed Ethereum ETF Decisions Cloud Short-Term Outlook
The US Securities and Exchange Commission’s (SEC) postponement of decisions on several spot Ethereum ETF applications, including those from Blackrock and Fidelity, casts a shadow on the short-term outlook. This delay, potentially lasting until May 23rd, could dampen investor enthusiasm, especially considering the positive impact a successful ETF launch could have had on price.
2. ETH Whale Activity: Mixed Signals
While recent whale activity suggests ongoing accumulation by major investors, with a high whaler transaction count and top addresses increasing their ETH holdings, net deposits on exchanges are also high compared to the 7-day average. This indicates potential selling pressure, particularly with a negative Korea premium reflecting bearish sentiment among Korean investors.
3. Derivatives Market Hints at Bearish Sentiment
The derivatives market also raises concerns. A red taker buy/sell ratio suggests futures investors are leaning towards selling ETH. However, analyzing liquidation heatmaps reveals strong support near $3,300, potentially acting as a safety net if the price corrects further.
4. Positive Sentiment and Dencun Upgrade Fuel Long-Term Optimism
Despite the short-term headwinds, long-term optimism remains. CoinMarketCap reports a surge in ETH’s trading volume to $33 billion, alongside a rising market cap of $456 billion. This signifies strong underlying fundamentals, bolstered by the upcoming Dencun upgrade scheduled for March 13th. This upgrade is anticipated to drive buying pressure and propel prices towards the all-time high.
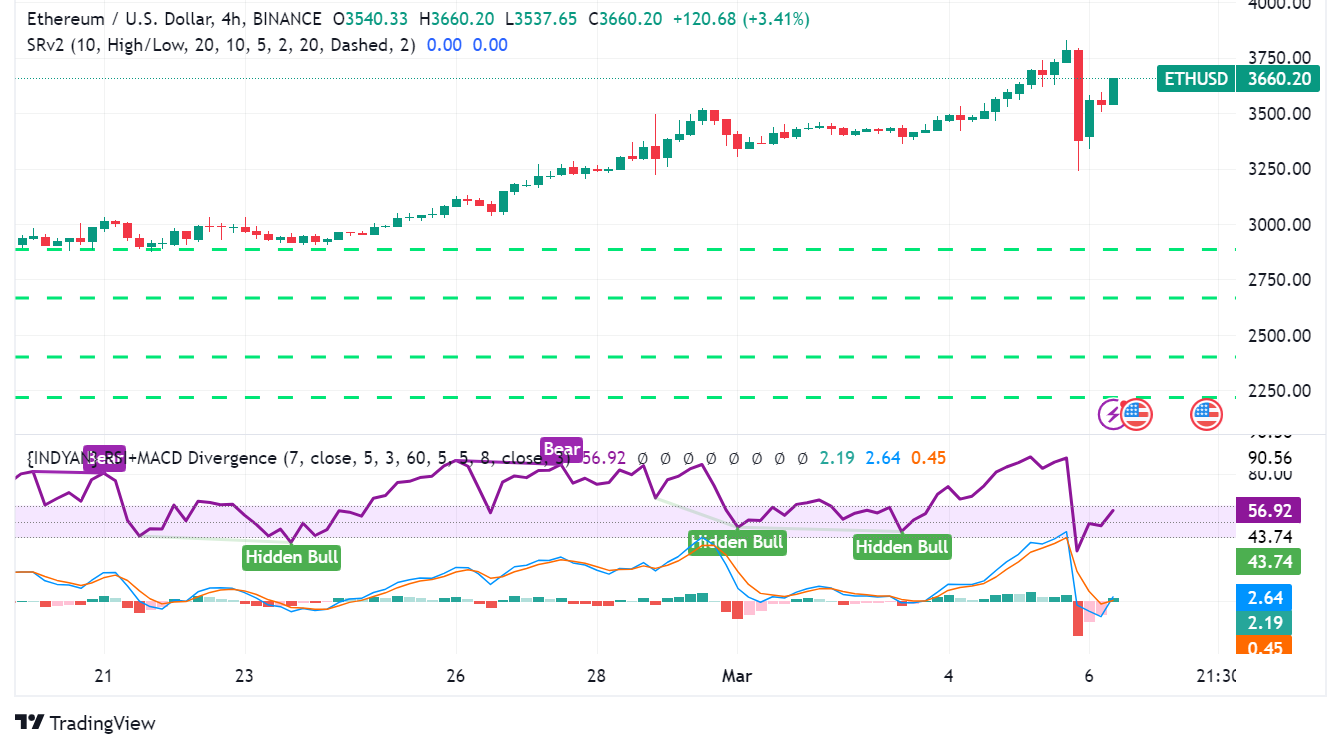
5. ETH/USD Technical Analysis
Traders, keep an eye on these technical indicators:
- Support: $3,300 – strong support level identified through liquidation heatmap analysis.
- Resistance: $4,000 – a key psychological barrier and potential breakout point.
- Moving Averages: The 50-day and 200-day moving averages can provide insights into the overall trend. Currently, these averages might be sloping upwards, indicating a potential bullish bias.
- Relative Strength Index (RSI): A reading above 70 suggests the asset might be overbought, while below 30 indicates it might be oversold.
Overall, Ethereum’s price action hinges on a complex interplay of factors. While short-term headwinds exist, long-term optimism persists due to strong fundamentals and the Dencun upgrade.
Sidebar rates
Related Posts
