Gold Price Forecast: Hovers Above $2000 Amid Mixed Market Cues
Gold’s market dynamics present a complex interplay as it hovers slightly above the $2,000 threshold, influenced by various economic and geopolitical factors.
The precious metal’s performance is delicately balanced between the upward pressure from Federal Reserve rate cut anticipations and the downward pull exerted by a rebound in US Treasury yields and a positive equity market sentiment.
Market Dynamics and Gold’s Valuation
- Gold struggles to extend gains, constrained by rising US Treasury yields and a firmer US dollar.
- Anticipations of Federal Reserve rate cuts, spurred by disappointing US retail sales data, offer support.
- Geopolitical tensions in the Middle East may bolster gold’s safe-haven appeal, amidst technical resilience.
Despite these challenges, gold’s refusal to capitulate below the 100-day SMA signals a cautious stance among traders against betting on a significant downtrend for XAU/USD. Attention now turns to upcoming US economic indicators and Federal Open Market Committee (FOMC) members’ speeches, which are poised to influence the dollar’s trajectory and, by extension, gold’s near-term prospects.
Upcoming Economic Indicators and FOMC Insights
- Gold’s immediate future is tethered to US economic indicators such as the Producer Price Index (PPI) and Housing Starts.
- Market sentiment is swayed by expectations of Fed’s monetary policy direction, highlighted in recent speeches by FOMC members.
- The potential for a shift in interest rates, as hinted by recent US economic data, plays a crucial role in gold’s valuation.
The intertwining of these factors creates a nuanced landscape for gold, with investor sentiment reacting to shifts in economic data and policy projections.
The upcoming US economic calendar, featuring the Core PPI, PPI, Building Permits, and Preliminary University of Michigan Consumer Sentiment, will offer fresh insights into the economic backdrop against which gold’s value will be assessed.
Key Considerations for Gold Investors
- Economic Data’s Role: Thursday’s US retail sales contraction and jobless claims dip influence Fed rate cut prospects, impacting gold prices.
- Geopolitical Impact: Escalating Middle East tensions, specifically Israeli military actions in Lebanon, inject uncertainty, potentially driving gold’s safe-haven demand.
- FOMC Commentary: Remarks by Atlanta Fed President Bostic on inflation and monetary policy adjustments underscore the importance of patience and data dependency in rate decisions.
As investors navigate this complex environment, gold’s path will be shaped by the interplay of economic indicators, geopolitical developments, and monetary policy expectations, underscoring the importance of staying attuned to forthcoming economic data and policy discourse.
Gold Price Forecast: Technical Outlook
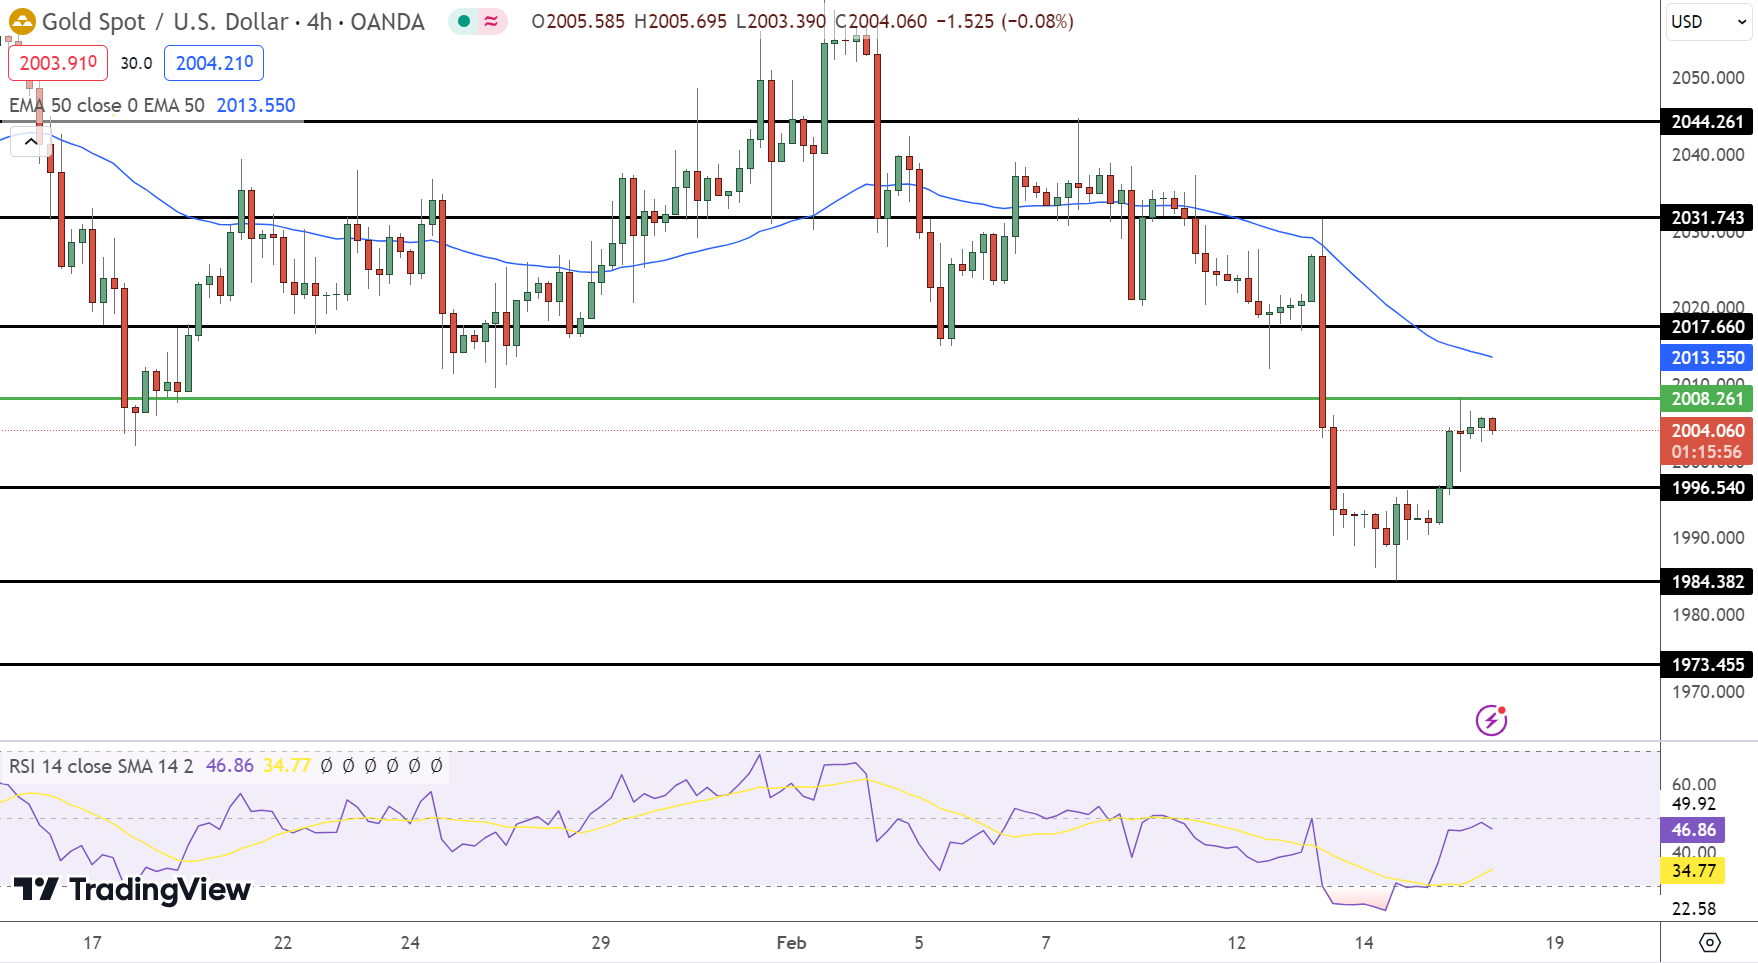
As of now, gold stands at $2003.675, experiencing a marginal decline of 0.04%. The technical landscape, as depicted in the 4-hour chart, emphasizes pivotal levels that could dictate the metal’s short-term movement. The pivot point at $2008.261 serves as a critical juncture, with immediate resistance observed at $2017.660.
Further barriers are poised at $2031.743 and $2044.261, delineating the challenges ahead for bulls. Conversely, support levels are established at $1996.540, $1984.382, and $1973.455, offering potential cushions for gold’s price retractions.
Technical Insights:
- The Relative Strength Index (RSI) sits at 46, hinting at a balanced yet cautious market sentiment.
- Gold’s struggle beneath the $2008 level, coupled with the formation of a Doji candle, signals potential selling pressure, indicating that buyers may be losing momentum.
- A decisive break above $2008 could pave the way for a test of the 50-day Exponential Moving Average (EMA) at $2013.55, potentially reshaping the market’s direction.
Market Implications:
- Gold’s current position, teetering just below the $2008 threshold, suggests a bearish outlook unless it surmounts this critical resistance.
- The interaction with the 50 EMA will be pivotal; surpassing this level may invigorate bulls, aiming for higher resistance points.
- Investors and traders should closely monitor these technical indicators and chart patterns to navigate the evolving dynamics of the gold market effectively.

Sidebar rates
Related Posts
