Gold Price Nears $2,020: Inflation Data Weighs on Bullish Sentiment
As the market fixates on upcoming U.S. inflation data, gold‘s recent slip to around $2,020 per ounce reflects heightened caution. The U.S. Dollar, finding strength from tempered bond yields, is casting shadows on the precious metal’s allure, with upcoming CPI figures being a key determinant of future Fed rate decisions.
Inflation Expectations and Fed Policy
January’s Core CPI month-over-month held steady at 0.3%, mirroring the previous period, while the broader CPI month-over-month eased to 0.2% from 0.3%. The year-over-year CPI, however, softened to 2.9% from 3.4%, suggesting a decelerating inflation trend.
These figures are influencing market predictions, with only a 14% chance of a Fed rate cut in March but a more considerable 60% expectation by May. Dallas Fed President Logan’s recent comments underscored a need for further evidence of lasting inflation control before any rate adjustments, indicating a potential delay in policy easing.
Geopolitical Tensions and Gold Prices
Gold prices also face headwinds from the U.S. Dollar’s demand spike due to recent Middle Eastern tensions, specifically missile strikes involving a ship heading to Iran. Additionally, the escalation of military activities by Israel in Gaza’s Rafah and the rejection of a ceasefire proposal by Israeli Prime Minister Netanyahu keep investors wary, further compounding gold’s challenges.
As traders parse through these geopolitical developments and anticipate the Fed’s next move, gold remains at a pivotal juncture, with its traditional role as a safe haven being tested against a backdrop of dynamic economic indicators and global uncertainties.
Gold Price Forecast: Technical Outlook
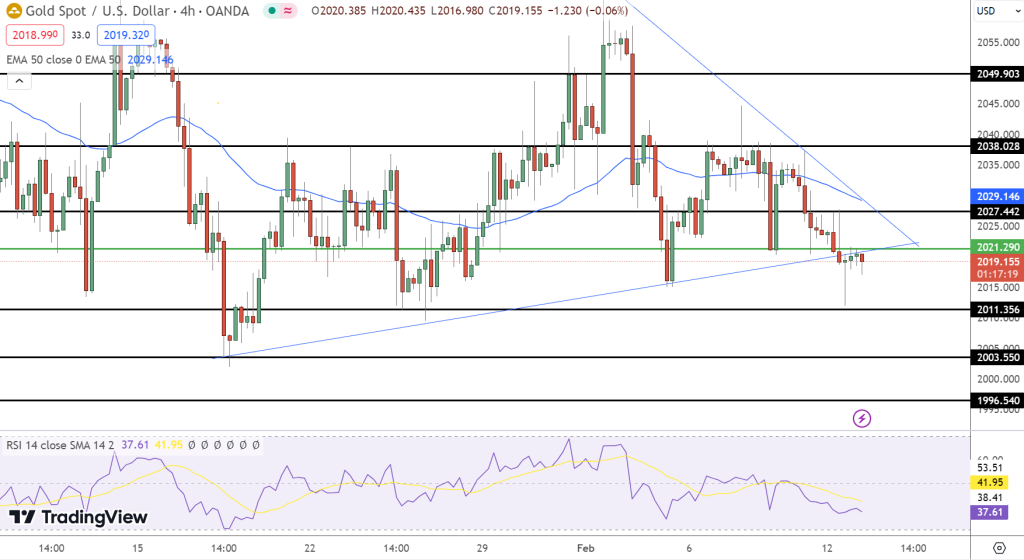
In the current technical landscape for Gold, the commodity navigates around a pivot point marked by the green line at approximately $2029.
The metal is confronting immediate resistance near the $2038 mark, with further ceilings at $2045 and $2049, delineating the levels bulls need to surpass to regain control.
On the downside, support is seen at $2020, with additional safety nets at $2011 and just below $2004, which could limit bearish movements.
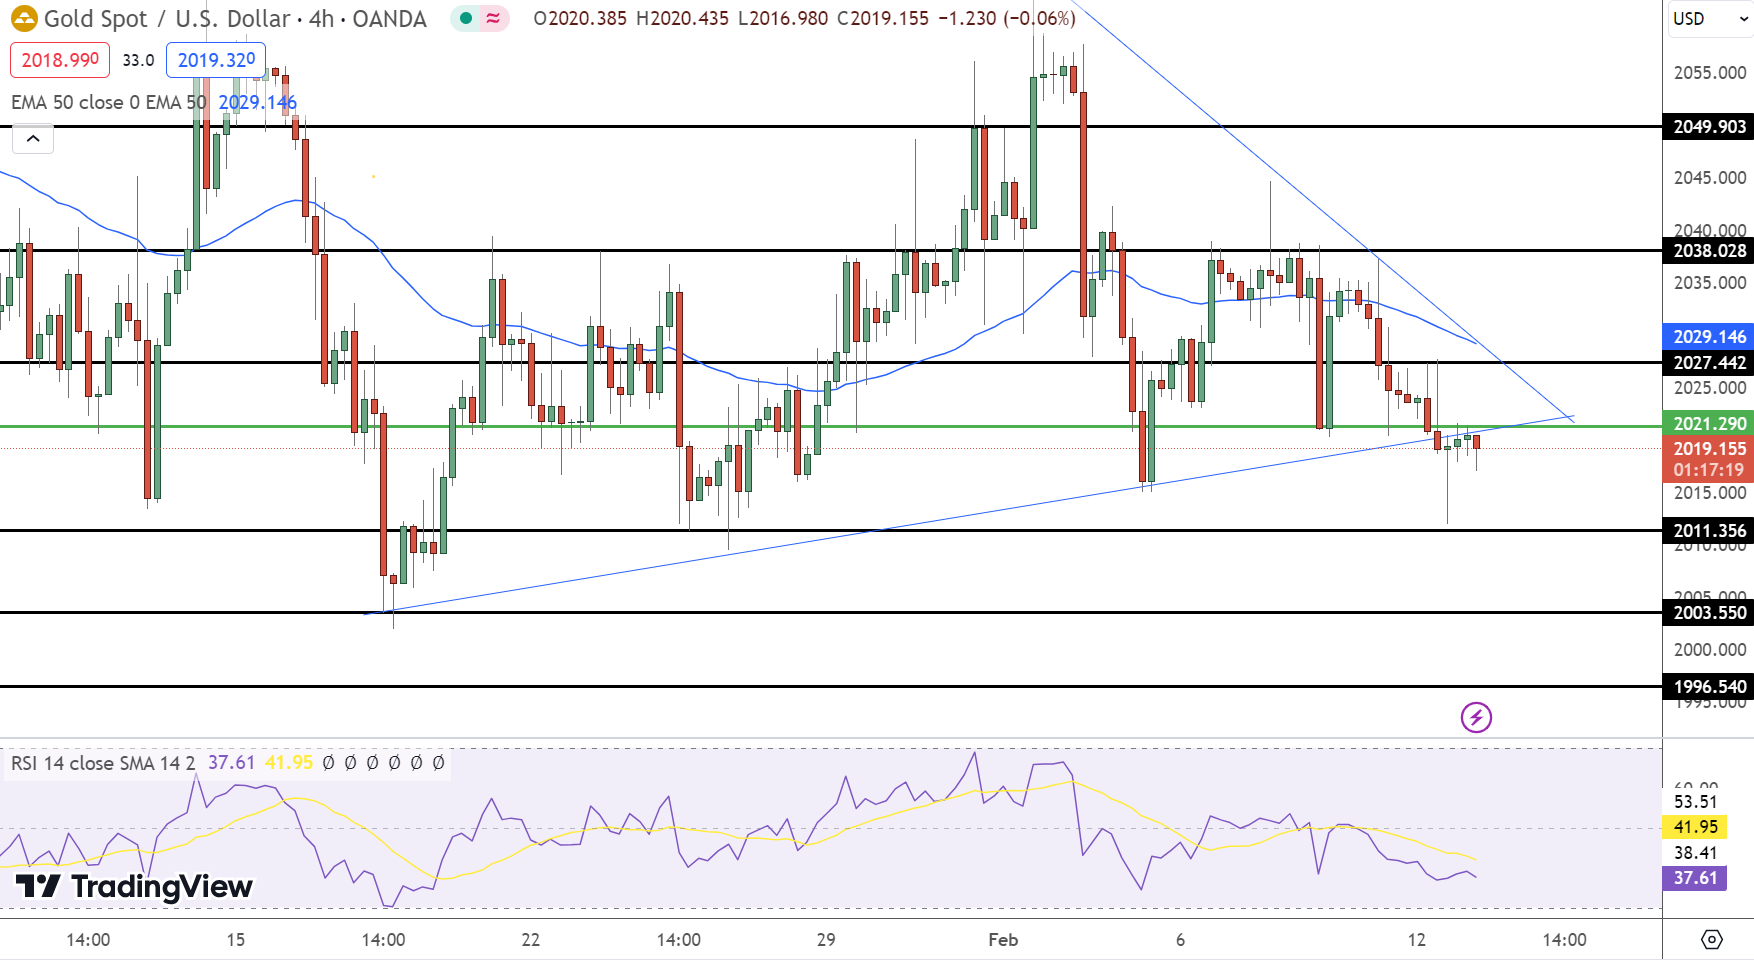
The Relative Strength Index (RSI) hovers near 41.95, leaning towards oversold conditions, suggesting that downward momentum may be overextended. The 50-day Exponential Moving Average (EMA), situated around $2029, is currently acting as a resistance zone.

Sidebar rates
Related Posts
