USD/CAD Dips to $1.34559 Amid Oil Surge and US Dollar Woes
The USD/CAD currency pair continued its decline, trading around the $1.34559 level as of February 8th. This downtrend aligns with a recent..
The USD/CAD currency pair continued its decline, trading around the $1.34559 level as of February 8th. This downtrend aligns with a recent spike in crude oil prices bolstering the Canadian dollar, thus exerting pressure on the USD/CAD pair. Additionally, the bearish momentum of the US dollar persists despite hawkish Federal Reserve expectations and strong US economic data.
Oil Market Developments Impacting USD/CAD
The US Energy Information Administration has revised its 2024 US oil production growth forecast downward, mitigating concerns over an excess supply. This adjustment is favorable for oil prices, as diminished US output helps prevent market oversaturation. Moreover, geopolitical tensions in the Red Sea, involving attacks by Iranian-backed Houthi rebels, have also propelled oil prices upwards, lending strength to the Canadian dollar.
The American Petroleum Institute reported a modest increase in crude oil inventories of 0.674 million barrels, well below the anticipated 2.133 million barrels, further bolstering oil prices and, consequently, the Canadian dollar.
USD Decline Weighs on USD/CAD
Conversely, the broad-based US dollar struggles to reverse its recent downtrend, remaining subdued since hitting a peak on November 14. This weakness is weighing on the USD/CAD pair, despite robust Non-Farm Payrolls data suggesting the Federal Reserve has leeway to maintain higher interest rates for an extended period.
Positive remarks from Federal Open Market Committee members have tempered expectations for sweeping policy shifts in 2024, reinforcing US bond yields and providing some support for USD bulls, potentially stabilizing the USD/CAD pair.
USD/CAD Price Forecast: Technical Analysis
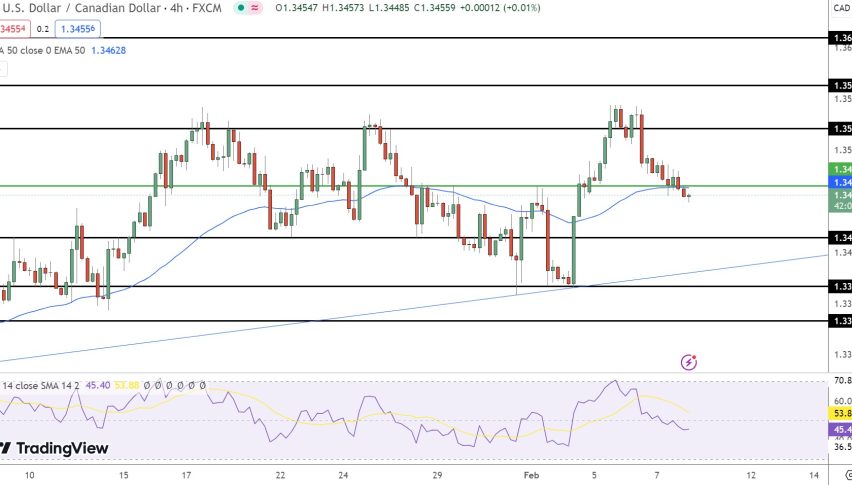
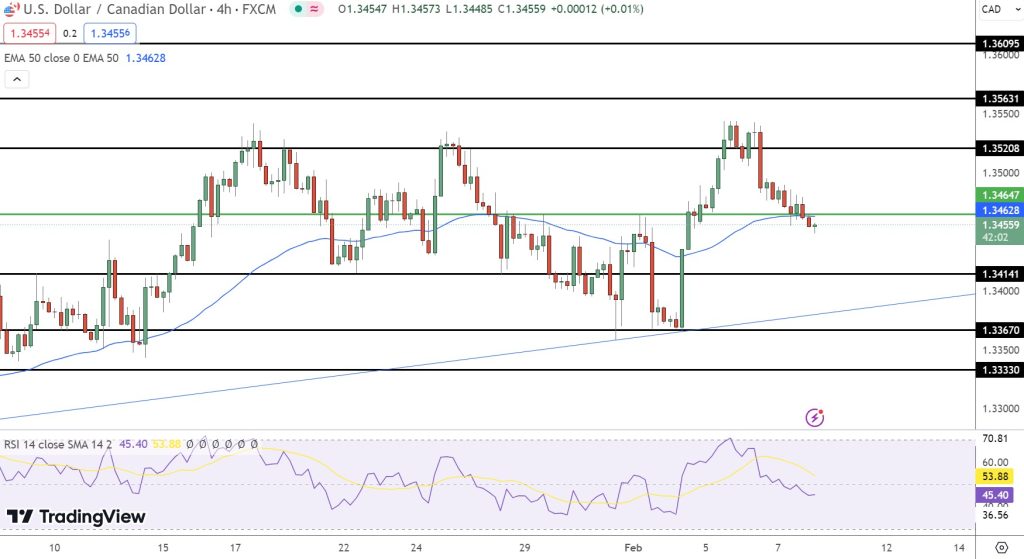
The USD/CAD pair remains in a holding pattern, with the current price marginally up at $1.34559, a subtle 0.01% increase within the last session. The pivot point is defined by the green line at $1.34628, providing a tentative equilibrium between buyers and sellers. Resistance levels are poised at $1.35208, $1.35631, and $1.36095, setting clear targets for bullish advancement.
On the downside, support forms at $1.34141, $1.33670, and a more pronounced floor at $1.33330. The 50-Day Exponential Moving Average (EMA) hovers at $1.34268, closely aligned with the pivot, while the 200-Day EMA sits lower at $1.33308, suggesting a neutral to slightly bullish bias if the pair maintains above the pivot.
With the Relative Strength Index (RSI) at 53.88, just above the midline, the pair’s trend leans neither overbought nor oversold, indicating potential for either movement as market participants gauge forthcoming economic catalysts.
- Check out our free forex signals
- Follow the top economic events on FX Leaders economic calendar
- Trade better, discover more Forex Trading Strategies
- Open a FREE Trading Account
Related Articles

Comments
Sidebar rates
Related Posts
