


Gold Price Forecast: XAU/USD Stabilizes at $2,033 Amid Fed Rate Cut Uncertainty and Dollar Fluctuations
As the European trading session unfolds on Thursday, Gold (XAU/USD) hovers around $2,033, encapsulating the market’s indecision regarding the Federal Reserve’s interest rate trajectory for the year.
The optimistic U.S. economic indicators coupled with Fed officials’ hawkish tones have tempered expectations for significant policy loosening, bolstering U.S. Treasury yields and presenting challenges for Gold, traditionally seen as a refuge during market turbulence.
Dollar’s Struggle and Support for Gold
Despite a risk-on market mood, the U.S. Dollar finds itself unable to attract investors, remaining subdued after reaching a near three-month peak. This stagnation offers some respite to Gold, amidst concerns over China’s economic deceleration.
The market’s cautious stance, opting to await forthcoming U.S. inflation data, underscores the anticipation for clearer Fed policy direction, which is pivotal for Gold’s momentum.
Federal Reserve’s Stance and Its Impact
Recent statements from Federal Reserve luminaries have recalibrated market expectations, dampening prospects for prompt, sharp rate reductions. Jerome Powell’s dismissal of a March rate cut underscores a strategic patience approach, with the economy’s resilience guiding policy adjustments.
Adriana Kugler’s acknowledgment of inflation progress, alongside Susan Collins and Neel Kashkari’s preference for further data before rate adjustments, reflects a cautious optimism.
Despite market bets on multiple rate cuts, the enduring strength of U.S. bond yields and the prevailing risk appetite are likely to restrain Gold’s potential gains, with upcoming U.S. economic releases and jobless claims data serving as immediate focal points for investors.
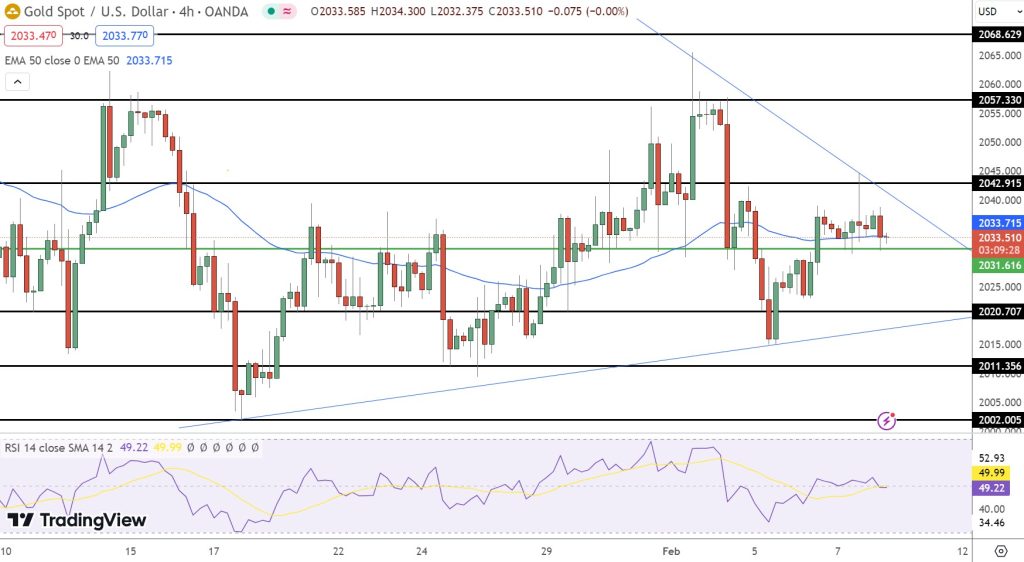
Gold Price Forecast: Technical Outlook
On February 8th, GOLD ‘s market posture remains tentatively bullish, with a slight decrease of 0.11% to $2,033. The pivotal marker, set at $2,031.61, directs the near-term trajectory. Resistance levels are staged at $2,042.53, $2,049.99, and $2,058.63, outlining potential ceilings for upward price action. Conversely, support is established at $2,022.75, with subsequent floors at $2,015.15 and $2,007.03, safeguarding against deeper pullbacks.
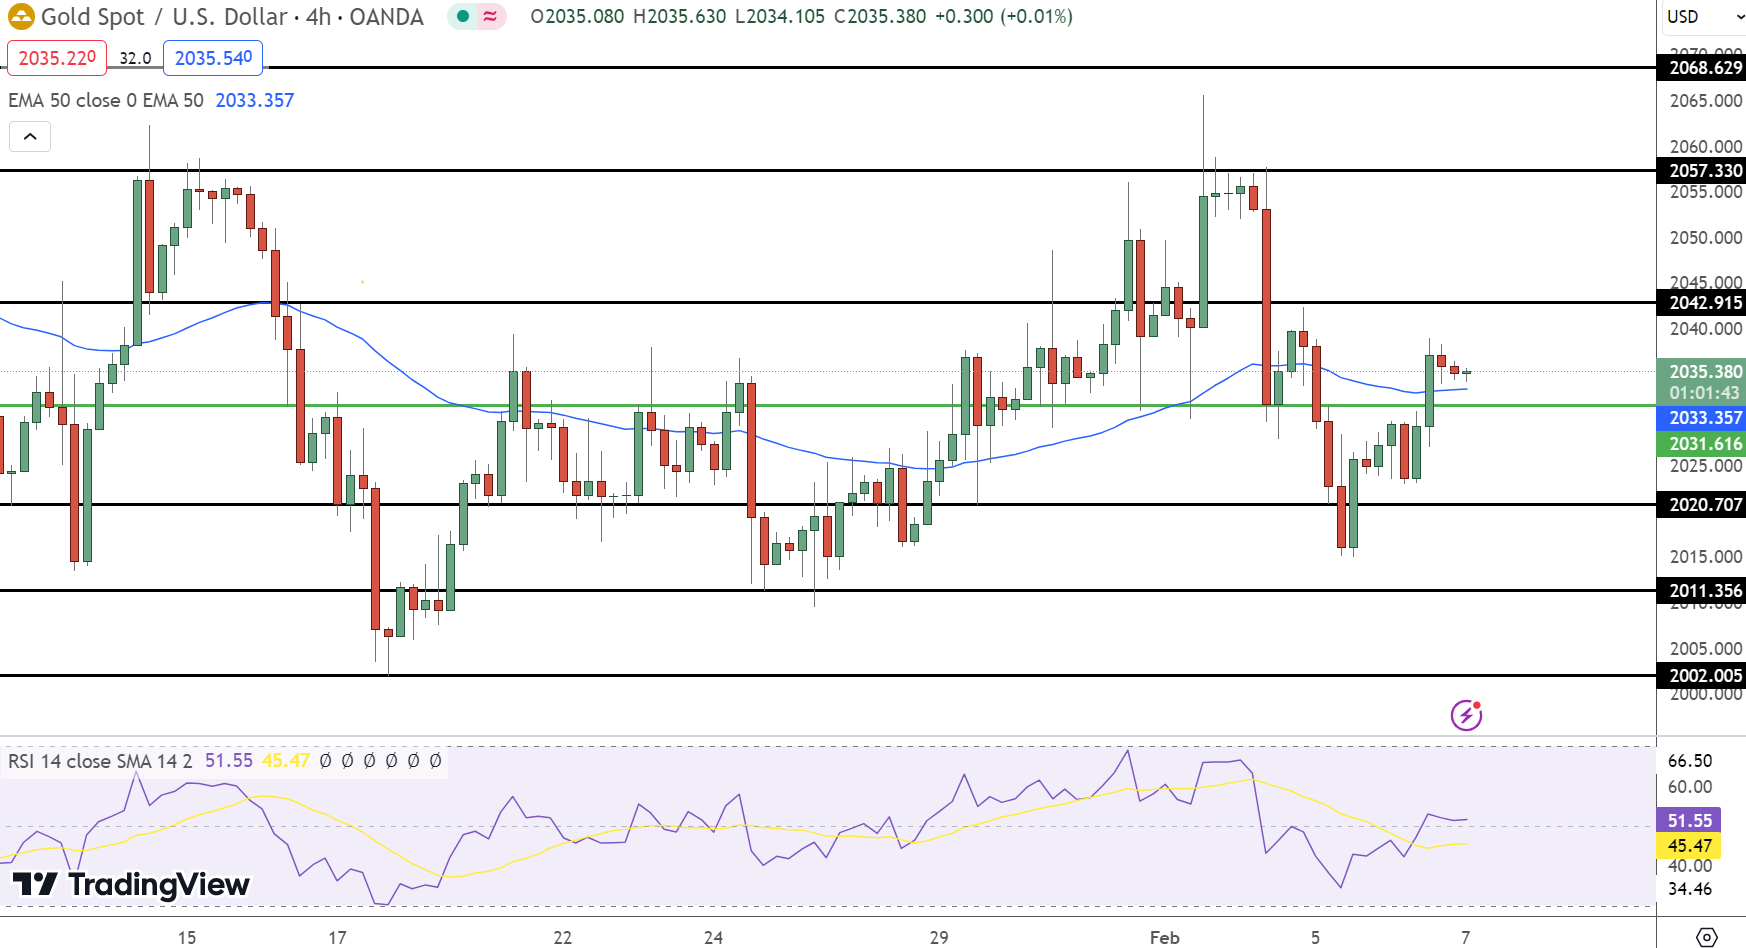
The Relative Strength Index (RSI) and the alignment of the 50-Day Exponential Moving Average (EMA) at $2,033.85 closely with the 200-Day EMA at $2,033.08, fortify a bullish outlook as long as prices hover above the pivot point of $2,031.61. This technical setup suggests Gold may soon challenge its immediate resistance levels, pending further market cues.
Gold XAU Live Chart


Sidebar rates
Related Posts
Add 3440

