Forex Signals Brief August 15: Employment, CPI and Retail Sales on the Agenda
Yesterday’s Market Wrap
Yesterday the price action was slow as the economic calendar was pretty light. The Asian and European markets started with a defensive tone and a slight tilt in risk asserts, and the USD in retreat. This sentiment also led to a decline in the Chinese Yuan’s value, which in turn exerted slight downward pressure on the commodity dollars at the start of the session.
However, as European trading hours commenced, there was a rapid rebound in stock prices, leading to a reversal in the overall mood. Major currencies also stabilized and ended up showing little change throughout the day, with the AUD and the NZD also bouncing up. Following this rebound, the trading session entered a relatively quiet phase, similar to the period of low activity observed last week.
Although risk sentiment started to turn sour as soon as the US session started and we saw a pullback in risk assets and a bullish move in the USD, which is a continuation of the price action witnessed in the last two weeks. So, there was some volatility, although the moves were small, around 30-40 pips in total.
Today’s Market Expectations
First, on the calendar today was the data from China, with Retail sales which were expected to show an increase of 4.2% in July, up from 3.1% in June, while industrial production was expected to tick lower to 4.1% from 4.2% previously. In Australia, th Q2 Wage Price Index is expected to tick up to 3.8%, up from the previous 3.7%. The Quarter-over-Quarter (Q/Q) reading is anticipated to increase to 1.0% from the previous 0.8%.
Moving to the United Kingdom, the Unemployment Rate is projected to stay unchanged at 4.0%. The primary focus here is on wage data, particularly the Average Earnings ex-Bonus, which is expected to see a rise to 7.4% from the previous 7.3%. Additionally, Average Earnings including bonuses are anticipated to be 7.3%, compared to the earlier figure of 6.9%.
in the US session, Retail Sales are predicted to increase by 0.4% in July, up from 0.2% in June. Meanwhile, the Year-over-Year (Y/Y) reading is expected to reach 1.5%, a slight rise from the previous 1.49%. The Control Group, often considered a more accurate measure of consumer spending, will likely carry significant importance. Although there’s no current consensus, the prior release showed a 0.6% increase.
In Canada, the Consumer Price Index (CPI) YoY is expected to slow again to 2.7% from the previous 2.8%. The Bank of Canada (BoC) is particularly focused on underlying inflation data. The Common CPI Y/Y is projected to be 4.7%, down from the prior 5.1%, the Trimmed Mean CPI Y/Y is seen at 3.4% compared to the earlier 3.7%, and the Median CPI Y/Y is expected to be 3.7% compared to the previous 3.9%. It’s important to note that the BoC’s target range for inflation is between 1% and 3%.
Forex Signals Update
Yesterday the volatility was low as we mentioned above, with most assets bouncing in a range, although there was enough price action to open several short term forex signals. We opened five trading signals remaining long on the USD, four of which closed in profit while one resulted in a loss.
For more detailed updates, please refer to the section below.
GOLD Approaching $1,900
The price of gold continues to make lower highs, as it struggles to sustain any gains after going through a bearish reversal about a month ago. Despite occasional upward spikes, the overall pattern has been characterized by the formation of successively lower lows as shown on the H1 chart above. These intermittent upward movements have been brief in duration, and MAs have transformed into resistance for the XAU/USD, causing the highs to decline.
In this context, a strategy of selling during these upward spikes has been employed. Over the course of the previous week, a number of sell signals for gold were initiated. All of these signals proved to be profitable, reflecting the continued dominance of sellers in the market.

XAU/USD – 60 minute chart
Considering the current market conditions, we are providing a trading signal as follows:
- Gold Sell Signal
- Entry Price: $1,915-20
- Stop Loss: $1,931
- Take Profit: $1,902
AUD/USD Trading Below 0.65

AUD/USD – 240 minute chart
- AUD/USD Sell Signal
- Entry Price: 0.6500
- Stop Loss: 0.6550
- Take Profit: 0.6420
Cryptocurrency Update
BITCOIN Can’t Keep the Gains
The pressure has been to the downside for Bitcoin, following the bearish reversal and the decline below $30,000. The value of Bitcoin experienced a decline beneath $28,000, though there have been recent indications of buyers coming back. This was highlighted by a couple of upward movements above $30,000, leading to a breach of moving averages on the H4 (4-hour) chart. It’s worth noting that these attempts at an upward movement eventually lost momentum, resulting in a reversal below the $30,000 mark for BTC/USD. Yesterday we saw another attempt from buyers, but the 200 SM A(purple) held as support n the H4 chart and the price ca,e back down. We continue to remain long on BTC though.

BTC/USD – H4 chart
We opened another buy Bitcoin signal on Monday, playing the range again, buying BTC/USD below $30,000:
- BTC Buy Signal
- Entry Price: $29,421.68
- Stop Loss: $27,400
- Take Profit: $32,400
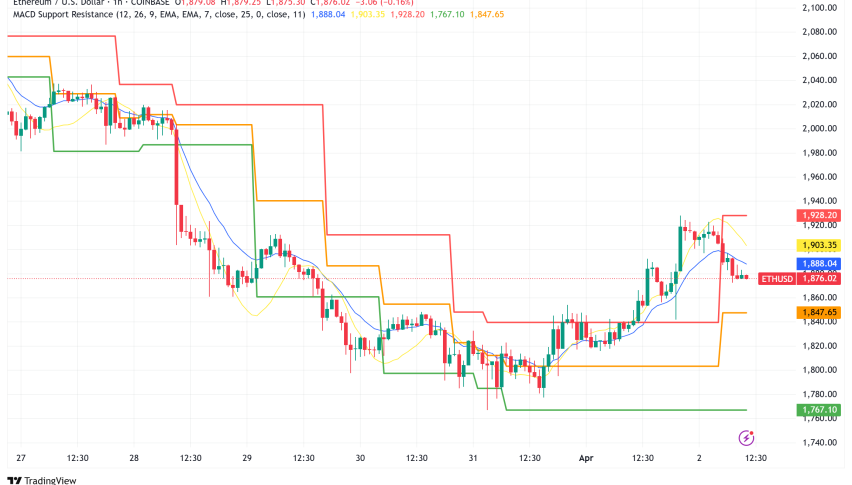
ETHEREUM Trading Between MAs
Earlier this month, Ethereum showed a decent rebound, sending it above the $2,000 threshold as buying activity remained dominant. Despite the prevailing bearish trend that has persisted since the beginning of 2023, characterized by a series of progressively lower lows, Ethereum has exhibited a greater degree of resilience compared to Bitcoin.
In light of this observation, a number of long-term “buy” signals for Ethereum have been generated. Despite the prevailing downward pressure, Ethereum has demonstrated a noteworthy ability to withstand these challenges. In response to a recent pullback, a decision was made to initiate a “buy” signal for Ethereum on Monday. This strategic move is based on the expectation that various moving averages will serve as supportive levels, potentially arresting the retreat. Notably, the 100-period Simple Moving Average (SMA), depicted in green, appears to be fulfilling this supportive role.

ETH/USD – Daily chart
- Entry Price: $1,860
- Stop Loss: $1,740
- Take Profit: $2,020


Sidebar rates
Related Posts
