WTI Oil Prices Show Neutral-to-Bullish Outlook at 79 Amidst Ebbing Buyer Momentum
WTI technical breakdown
According to our WTI technical analysis for Wednesday, the West Texas Intermediate (WTI) barrel displayed a subdued performance in trading, as investors eagerly awaited the decision from the Federal Reserve (Fed). Compounding this, the Energy Information Administration (EIA) released a report indicating a decrease in inventories for the week ending on July 21, though the decline was not as substantial as expected, putting downward pressure on oil prices.
Conversely, the USD DXY Index is experiencing a decline, while US Treasury yields are also decreasing in anticipation of the upcoming Federal Reserve (Fed) announcement later in the session. The market has already factored in a 25 basis point (bps) increase, but there is a low probability of a similar increase in September (20%) and November (45%), respectively, as indicated by the bets placed by investors.
Given the absence of an updated macro forecast or dot plot, investors will have to rely on interpreting the forward guidance messaging in order to shape their expectations for the upcoming Federal Reserve meetings. It’s important to note that higher interest rates often have a dampening effect on economic activity. Consequently, the speculations and bets regarding the Federal Reserve’s future decisions could significantly impact the dynamics of WTI prices. Investors will closely monitor the central bank’s communication to gauge their potential actions and adjust their strategies accordingly.
Indeed, the announcement made on Tuesday about the Chinese government’s plans to increase economic stimulus is a positive development that could lend support to the WTI prices. China holds the position of being the world’s largest oil importer, and any efforts to bolster economic activity in the country are likely to result in increased oil demand. This uptick in demand from such a significant player in the global market could have a favourable impact on the dynamics of WTI prices, providing a potential boost to the oil market. Investors will closely observe how these economic stimulus measures unfold and how they may influence oil demand and prices moving forward.
WTI technical analysis: Daily chart analysis of WTI
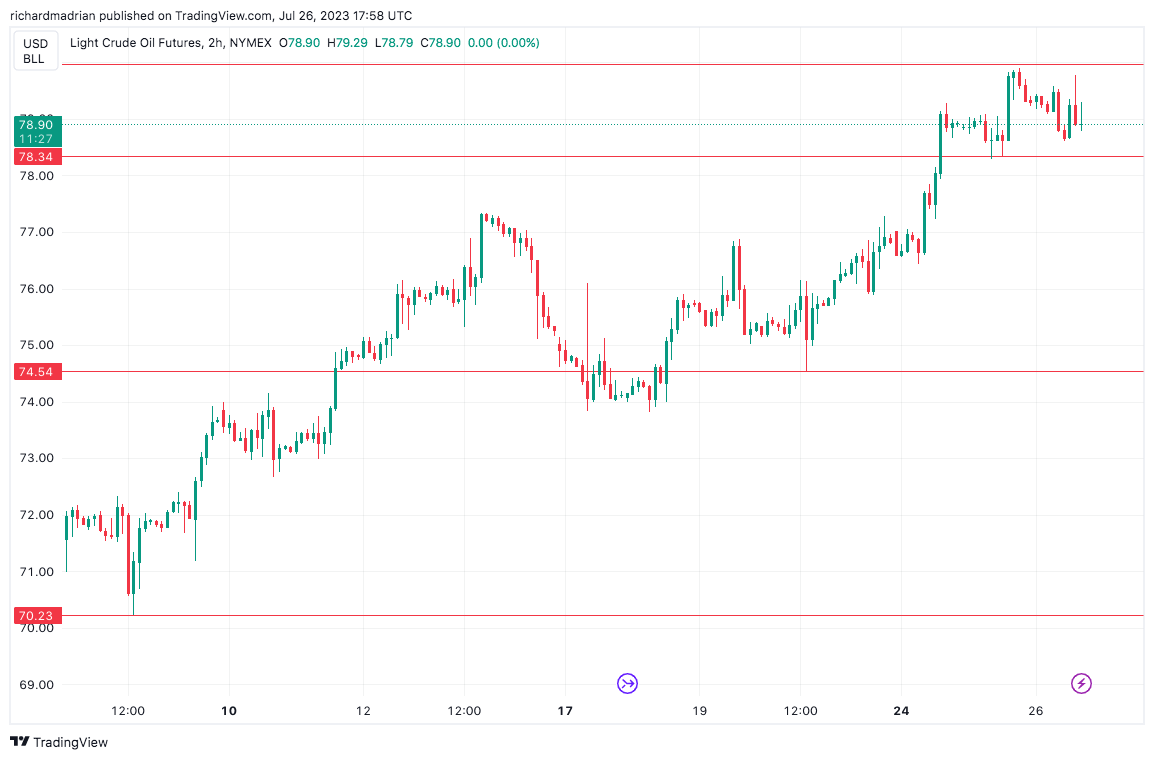
Based on the daily chart analysis of WTI, the short-term outlook appears to be neutral to bullish. However, there are signs that buyers might be losing momentum. The Relative Strength Index (RSI) is showing a neutral slope near the overbought threshold, indicating that the buying pressure has eased. Additionally, the Moving Average Convergence Divergence (MACD) has printed a lower green histogram, suggesting that bullish momentum is diminishing.
While the overall outlook is still leaning towards a positive direction, investors should remain cautious due to the potential loss of bullish strength. It would be prudent to keep a close eye on how these indicators evolve in the coming days to assess whether the market sentiment remains favourable or starts to shift towards a more bearish stance.


