Bitcoin Steady Above $19,000 – Quick Daily Outlook
Bitcoin's price gradually fell under $19,200 versus the US dollar. BTC is still trading just above key breakdown support, which is about

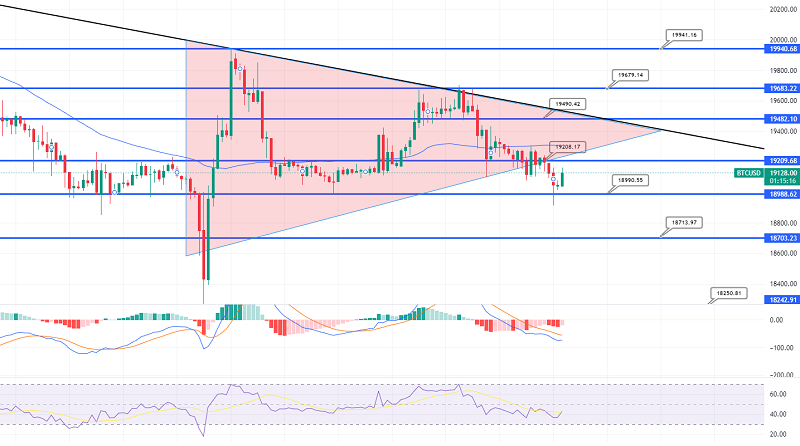
Bitcoin’s price gradually fell under $19,200 versus the US dollar. BTC is still trading just above key breakdown support, which is about $18,500. Bitcoin’s price gradually dropped to just above the $19,500 barrier level. BTC fell underneath the $19,250 and $19,200 support levels, entering a bearish zone in the immediate term.
The bears even drove the price below $19,000, with a close beneath the 100 hourly simple moving average. The price has dropped as low as $18,900 and is now correcting higher. The price rose above the $19,000 mark.
BITCOIN is trading below the $19,200 mark and the 100 hourly simple moving average. On the hourly chart of the BTC/USD pair, a key negative trend line is forming with resistance near $19,180.
On the upside, a resistance level is approaching $19,090. It is close to the 23.6% Fib retracement level of the latest slide from the swing high of $19,697 to the low of $18,900. The first significant barrier is located between the $19,200 level and the trend line.
Bitcoin (BTC/USD) Technical Outlook
The next big resistance level might be $19,300, or the 50% Fib retracement level of the recent slide from the swing high of $19,697 to the low of $18,900. A decisive break above the $19,300 resistance level might kick-start a decent uptrend. In this scenario, the price may challenge the $19,500 resistance. Any further advances could sustain a sustained rise toward the $20,000 barrier zone.
If bitcoin fails to break through the $19,300 barrier level, it may continue to fall. On the downside, there is immediate support near $19,000. The next major support level is around $18,900. A price break to the downside might bring the price down to the key breakdown support at $18,500. Any more losses might drive the price to $17,800, increasing selling pressure.
- Check out our free forex signals
- Follow the top economic events on FX Leaders economic calendar
- Trade better, discover more Forex Trading Strategies
- Open a FREE Trading Account


