


Will Ethereum ETH, Fantom FTM Break Above MAs Before or After A Retreat?
Cryptocurrencies retreated lower from November until January, while for Fantom the decline continued until March, after the departure of key personnel, but it seems like buyers are attempting seriously to resume the large bullish trend. They have been pushing the crypto market higher since early March, but Ethereum and Fantom have some resistance to take out above at moving averages, so the larger trend is not bullish yet, until buyers push above those resistances.
Fantom Daily Chart – FTM Hesitating the 50 SMA

Will the 50 SMA turn into resistance?
Fantom suffered a couple of negative events this year, with the wonderland controversy in January which weighed on the DeFi sector and sent FTM down to the support at $1.30. Andre Cronje who is a prolific developer and Anton Nell, a senior solutions architect at Fantom announced that they were going to leave Fantom and the DeFi scene as a whole. That weighed on FTM/USD further and sent it down to $1.04.
The sentiment in the crypto market had already started to turn positive and by the middle of March Fantom started to turn bullish as well. Buyers pushed above the previous support at $1.30, but they are having trouble at the 50 SMA (yellow) on the daily chart. The price is overbought on this timeframe as the stochastic indicator shows, so a retrace lower is due, although it remains to be seen whether we will see a pullback.
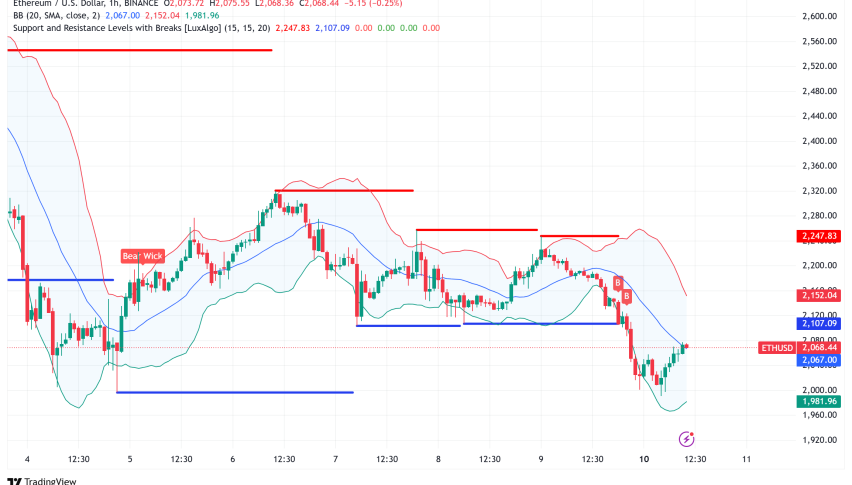
Ethereum Daily Chart – Can the 200 SMA Reject ETH?

Ethereum climbs above $3,500
Ethereum stopped declining in January, but it continued to make lower highs in late February and has been displaying bullish pressure since the middle of March, as buyers have pushed the price higher. The 50 SMA (yellow) was broken and it turned into support. ETH began another increase and pushed above $3,000 and now it has moved above the $3,500 level as well.
Although, Ethereum has been hesitating around this area for more than a week. We heard that $5 billion ETH was transferred into exchanges while outflows totaled $6 billion, which means a $1 billion deficit, suggesting that traders might be cashing out and booking some profit after the gains since last month. But, let’s see whether there will be a pullback because the price is sticking to the 200 SMA, which indicates a break higher soon since sellers can’t send the price down.
Ethereum Coin ETH Live Chart
Sidebar rates
Related Posts
Add 3440

