Bitcoin Spikes to $42K, Uptrend to Extend Support
Bitcoin began a steady rise above the $42,000 resistance level against the US dollar. BTC recently corrected lower after testing the $43,400

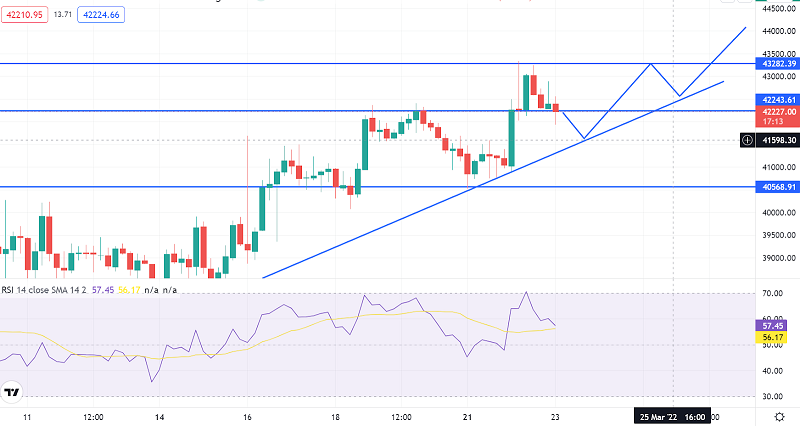
Bitcoin began a steady rise above the $42,000 resistance level against the US dollar. BTC recently corrected lower after testing the $43,400 zone. Following a test of $43,400, Bitcoin began a downward correction. It is currently trading above $42,000 as well as the 100 hourly simple moving average. On the hourly chart of the BTC/USD pair, a key bullish trend line is forming with support near $41,950. To stay in the green, the pair must stay above the $41,500 support level.
Bitcoin’s Price Remains in an Upward Trend
After breaking through the $42,000 resistance level, the price of Bitcoin began to rise steadily. BTC accelerated its move above $42,500 and settled above the 100 hourly simple moving average. The price rose so far that it broke through the $43,200 resistance level. It reached a high of $43,402 and is now correcting lower. The price fell below the 23.6 percent Fib retracement level of the recent rise from the $40,510 swing low to the $43,402 high.
The bulls, on the other hand, are defending the $42,000 support zone. On the hourly chart of BTC/USD, a key bullish trend line is forming with support near $41,950. The trend line is close to the 50 percent Fib retracement level of the recent increase from the swing low of $40,510 to the high of $43,402.
On the upside, the price is encountering resistance near $42,800. The next major resistance level could be around $43,000. A successful break and close above the $43,000 level could signal the start of another steady rise. In the aforementioned scenario, the price could rise to $43,500. Any further gains could push the price up to $44,200 in the coming sessions.
BTC Downside Break?
If Bitcoin fails to break through the $43,000 resistance level, it may fall even further. On the downside, there is immediate support near $42,000.
The trend line and the 100 hourly SMA are the next major supports. The main support is located near $41,500. (the previous breakout zone). A break below the $41,500 support level could push the price even lower, towards $40,500.
- Check out our free forex signals
- Follow the top economic events on FX Leaders economic calendar
- Trade better, discover more Forex Trading Strategies
- Open a FREE Trading Account


