Metaverse Coins Moving Identically, Showing Signs of a Strong Bounce: MANA, GALA, SAND

The bearish cryptocurrency market has been lethargic for the past months, and it has been making even lower lows in the past few weeks. However, the past few days have been different. Selling pressure on large caps, such as Bitcoin (BTC) and Ethereum (ETH), has slowed down, with smaller altcoins finally showing glimpses of bullish demand.

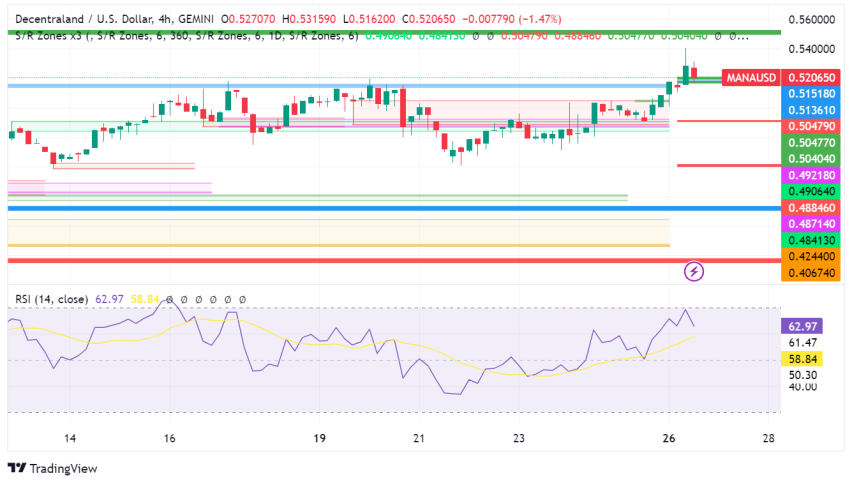
*Decentraland (MANA) Daily Timeframe Chart: Metaverse Coins Moving Identically

* Gala Games (GALA) Daily Timeframe Chart: Metaverse Coins Moving Identically

*The Sandbox (SAND) Daily Timeframe Chart: Metaverse Coins Moving Identically
Metaverse coins, in particular, such as Decentraland (MANA), Gala Games (GALA) and The Sandbox (SAND), have been moving almost identically to each other. Here are some noteworthy similarities:
- All of them have been trading in a downward channel since hitting new all-time highs (almost at the same time) on November 25-26, 2021. They also all hit recent lows on the same day – January 22, 2022. Here are each of their all-time highs and recently made lows:
| Metaverse Coin | Period | High | Low | Gain/Loss % |
| MANA | NOV. 25 & JAN. 22 | 5.90 | 1.7050 | -71% |
| GALA | NOV. 26 & JAN. 22 | 0.8412 | 0.1538 | -82% |
| SAND | NOV. 25 & JAN. 22 | 8.48 | 2.56 | -70% |
- All experienced extreme selling 1-2 weeks ago, after rallying in an attempt to break above the downtrend line resistance
| Metaverse Coin | Period | High | Low | Gain/Loss % |
| MANA | JAN.17 – 22 | 3.18 | 1.70 | -46% |
| GALA | JAN.17 – 22 | 0.3297 | 0.1538 | -53% |
| SAND | JAN.17 – 22 | 4.96 | 2.56 | -48% |
- After falling sharply, all 3 coins took 3 days (Jan. 23, 24, 25) of relatively tight trading ranges, or so-called “pause” days, before rallying back up.
- The pause days all exhibited a strong recovery rally from recent lows: Jan. 22 to today
| Metaverse Coin | Period | High | Low | Gain/Loss % |
| MANA | JAN.22 – 26 | 2.27 | 1.70 | +34% |
| GALA | JAN.22 – 26 | 0.2161 | 0.1538 | +41% |
| SAND | JAN.22 – 26 | 3.2718 | 2.56 | +28% |
- The RSI Indicators of all three coins fell below the oversold level briefly before rallying.
- None of the RSI’s have shown any signs of divergence from price action
- This suggests that the price action also respects the downward RSI trendline and vice-versa
- This is important as it could signal a time to take profit from all short-term bounce trades
Key Takeaways
As a trader or investor, it is wise to always diversify your trades or investments, to spread the potential risks that may occur in your portfolio. Since all three metaverse coins have exhibited almost identical movements to each other, it would not be advisable to allocate funds to all three coins.
If they rally, you gain big, but if they fall, you lose big as well. Longevity is the key in the investing and trading business. Capital preservation is the number one priority, and capital gains are just secondary. Taking unnecessary additional risks to “win big” is a gambler’s mentality that is unsustainable and will soon wipe out your account. Risk management is of utmost priority above all things, especially now that the overall financial market environment has become more volatile than ever.
Trade Recommendation: Buy the Bounce, Take Profits at the Nearest Resistance Levels
At the time of writing, all three metaverse coins had already hit their trigger buy points, but you can still participate, as this could just be the start of a stronger move. However, since you are a bit late and over the ideal buy points, it would be best to tighten your stop losses. Ideally, these should not fall below the low of today’s candles. Immediately take profits at the nearest resistance levels or at any signs of reversals or sudden institutional sell downs. Remember, the overall long-term bias is still bearish.
Here are the important points for each coin:
- MANA
- Stop-loss Low of today: 2.0772
- Take Profit at 23.6% Fib and Down Trendline Resistance: 2.60
- GALA
- Low of today: 0.18407
- Take Profit at Down Trendline Resistance: 0.2600
- SAND
- Low of today: 3.0049
- Take Profit at 23.6% Fib and Down Trendline Resistance: 3.90 – 4.00
- Check out our free forex signals
- Follow the top economic events on FX Leaders economic calendar
- Trade better, discover more Forex Trading Strategies
- Open a FREE Trading Account


