Buy Avalanche (AVAX/USD) and Uniswap (UNI/USD) after Retreat to Key Level
Avalanche (AVAX/USD) Steady at $82 Support
After staging a price rally in mid-December, up to the 22nd of the same month, Avalanche (AVAX/USD) failed to replicate the strong gains, plunging back to the support at $82. The $82 support was tested on December 15 and November 11, and most recently on January 10, before AVAX/USD started a rebound. Now, AVAX/USD is seen retreating, after retesting the support, opening a good opportunity for traders looking to go long.
– A Technical Outlook on the Daily Chart

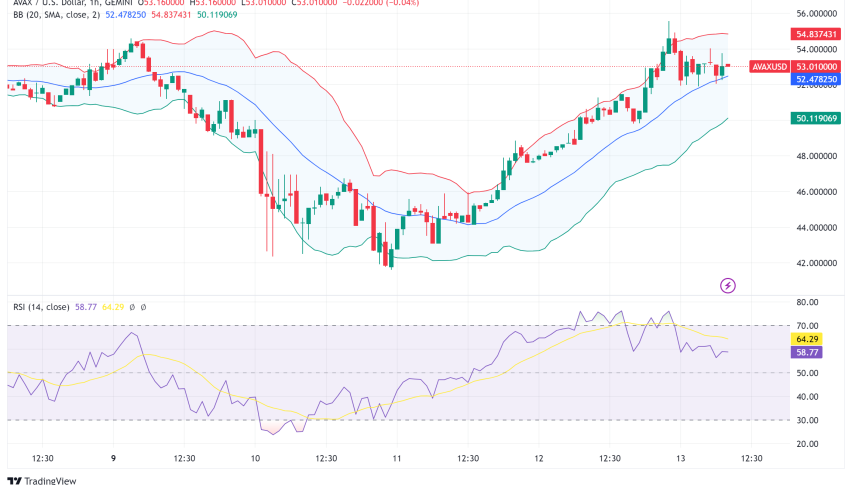
Looking at the daily chart, AVAX/USD has established support at $82, and this becomes the reference point for the buyers. At the current trading level of $89.4, AVAX/USD is trading slightly above the support, and it is already retreating to the key level. Similarly, the relative strength index shows a reading of $43, suggesting that AVAX/USD is neither overbought, nor oversold. However, it should be noted that AVAX/USD rebounded from an almost oversold region, as the RSI was at 35 on January 8.
AVAX/USD Weekly Chart – A Pivot at $82
Looking at the longer time frame could offer clues on the potential pivot point for AVAX/USD. On the weekly chart, AVAX/USD left a bullish pin bar at the support of $82. The bullish pin bar shows that AVAX/USD has rejected price falls below $82, and if the current price action holds, the crypto token could now be prepared to go higher to recent tops.

AVAX/USD Trade Idea
AVAX/USD represents a buy opportunity on the current retreat as long as the support of $82 continues to hold. I would enter a buy trade after a slight dip, but I would monitor price moves in the next few days as prices can rebound quickly from the current levels. A buy trade taken at the current level should target areas around $96, $114, and up to $126.
Uniswap (UNI/USD) Rebounding from $16.8 on a 4-Hour Chart
Since January 14, Uniswap’s UNI/USD has been on a strong footing. The token jumped from a low of $15.18 on January 14, and hit a high of $18.17 on January 16. The surge saw the token breach the resistance at $16.82, which is now becoming a support zone. At the current trading of $17.21, UNI/USD is on a minor correction from a bullish momentum in the last three days.

On the 4-hour chart, we can see that UNI/USD is rebounding after dipping close to the support at $6.82. Both the 9-day and 14-day moving averages provide support below, with a bullish momentum underway, as demonstrated by the higher highs and higher lows.
UNI/USD Trade Idea
I would recommend a buy trade on UNI/USD at the current level or after a slight drop, as long as the $16.82 level continues to hold. The level at $18.15 is the immediate resistance for UNI/USD after which I would be my first take-profit profit. Other levels for UNI/USD are $18.71, $19.82, and potentially $24.90 and beyond, if the crypto token maintains the bullish momentum. Good luck!
Sidebar rates
Related Posts
