Ripple Attempts Recovery, Why XRP Could Revisit $1.022
Arslan Butt•Monday, November 29, 2021•2 min read
The
XRP/USD was closed at $0.96902 after placing a high of $0.96902 and a low of $0.88781.
XRP/USD continued its upward momentum and rose for the second consecutive session on Sunday to recover another portion of its previous loss. On Sunday, it dropped to its lowest since September 29th, on the back of the rising strength of the US dollar; however, the cryptocurrency started moving upward on the back of positive news fragments surrounding the Ripple ecosystem.
Ripple Live Rate
According to the CEO of Ripple, Brad Garlinghouse, the 2020 lawsuit filed against his blockchain payments company by the US Securities and Exchange Commission was moving in the right direction. The SEC filed that the company sold about $1.3 billion worth of
XRP, which the SEC called unlicensed securities; however, Ripple maintains that XRP cannot be classified as a security.
Garlinghouse said that the case was moving in the right direction as the judge asked essential questions. He said that it looked like the judge realized that this was not just about Ripple but also broader implications. He further predicted that the case would conclude in 2022.
Ripple’s XRP is currently the seventh largest cryptocurrency worldwide, but it was the third biggest cryptocurrency behind BTC and ETH before the SEC lawsuit. The lawsuit prompted Coinbase and other exchanges to delist XRP, which triggered a sell-off at the time. However, Ripple managed to recover its losses after it pointed to BTC and ETH and asked to know why those assets were exempt from the SEC. The latest positive comments from Garlinghouse that the case will be closed by 2022 raised XRP/USD prices over the weekend.
Ripple Technical Outlook – XRP to Revisit $1.02 Resistance
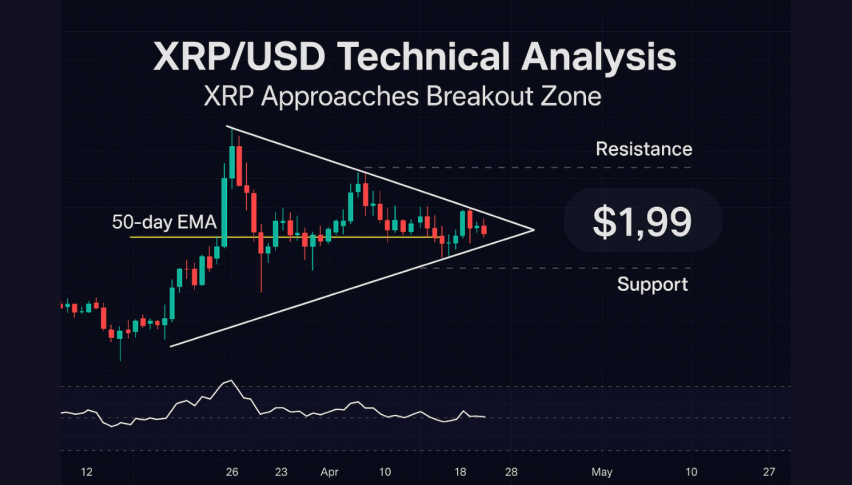
On the 2-hourly timeframe, XRP/USD has rebounded above the support level of $0.8955 level. Now it’s trading at 0.9910 level, crossing over the 20 and 50-day simple moving averages providing resistance at the $0.9900.
Lately, XRP/USD has closed the “Three white soldiers” pattern that indicates a solid bullish bias among investors. Moreover, the formation of candles above 20 and 50 SMA supports an uptrend.

Daily Technical Levels
Support Resistance
0.91488 0.99609
0.86074 1.02316
0.83367 1.07730
Pivot Point: 0.94195
Still, the downward trendline on the 4-hour timeframe is likely to act as a resistance at 1.0210. The breakout of the 1.0210 resistance level could drive a bullish trend until the 1.056 and 1.1051 levels. So let’s keep an eye on $1.020 as bearish bias dominates below this level and vice versa. Good luck!
Arslan Butt
Index & Commodity Analyst
Arslan Butt serves as the Lead Commodities and Indices Analyst, bringing a wealth of expertise to the field. With an MBA in Behavioral Finance and active progress towards a Ph.D., Arslan possesses a deep understanding of market dynamics.His professional journey includes a significant role as a senior analyst at a leading brokerage firm, complementing his extensive experience as a market analyst and day trader. Adept in educating others, Arslan has a commendable track record as an instructor and public speaker.His incisive analyses, particularly within the realms of cryptocurrency and forex markets, are showcased across esteemed financial publications such as ForexCrunch, InsideBitcoins, and EconomyWatch, solidifying his reputation in the financial community.


