Ripple, Terra LUNA Price Prediction – Bullish Chart Pattern in XRP and LUNA/USD
Ripple XRP and Terra LUNA are looking increasingly bullish
After the first crackdown on cryptocurrencies in May and the second one in September, the crypto market lost coherence. Some cryptos turned bullish and made new highs in October, such as Bitcoin and Ethereum, some stagnated such as Ripple and Dogecoin, some retreated such as Cardano, while some totally surged higher, such as Shiba Inu token. Although, this week looks quite positive for the entire crypto market, as buyers have returned.
Ripple Weekly Chart Analysis – XRP Bouncing Off the 20 SMA
Ripple has been one of the most boring cryptocurrencies recently, after the bullish run in August which followed the summer bearish period ended. During October when the crypto market turned bullish, Ripple coin remained stagnant, missing out on the bullish momentum.
Ripple XRP Live Chart
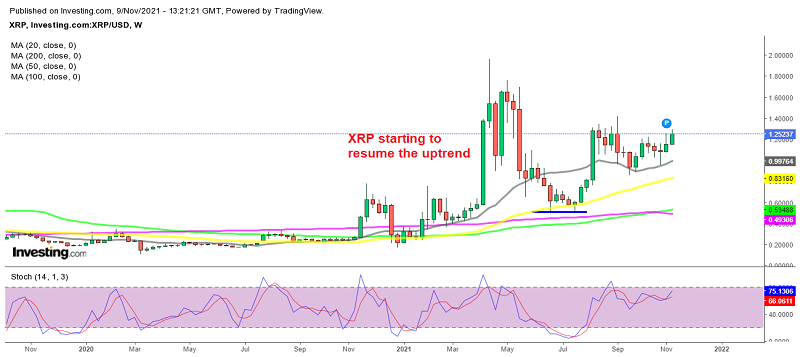
Although, the 20 SMA (gray) has been holding as support for the last two months on the weekly chart. In the last week of October Ripple formed a doji candlestick above the 20 SMA which is a bullish reversing signal and then came the bullish reversal of November so far for XRP/USD .
Investors are trying to get a piece of Ripple before it goes mainstream on an initial coin offering (ICO) when the legal battle with SEC is over. But the battle has been going on for too long, which was one of the reasons for Ripple trading sideways in the last two months.
Now, Judge Netburn of the Ripple case has ordered Ripple to search for and turn over the video and audio recordings of the company’s internal meetings. Ripple is entering the NFT (non-fungible token) market which should increase the interest further, hence more upside momentum is expected. We are holding on to our buy signal here, which we have opened at $1.28.
Terra Daily Chart Analysis – LUNA Targeting $55

The $50 level should turn into support now
Terra luna has turned quite bullish since late July, increasing from $4 to $54 yesterday. There have been retreats lower, but buyers have jumped in after every pullback and the bullish trend continues. The previous high of around $23 turned into support in September while in October the 50 SMA (yellow) took up that job. Last week buyers pushed above October’s high at $50 and yesterday they printed another high above $54.
One of the reasons for this massive bullish run is the fact that 160 project will be launched in Terra Luna early next year. Besides that. Terra is preparing to burn more than 9% of the total coins, which will bring deflation and appreciate the LUNA coins further. So, buyers are in control here and we are looking for a pullback lower so we can get in on this bullish trend.
- Check out our free forex signals
- Follow the top economic events on FX Leaders economic calendar
- Trade better, discover more Forex Trading Strategies
- Open a FREE Trading Account
Related Articles

Comments
Sidebar rates
Related Posts
