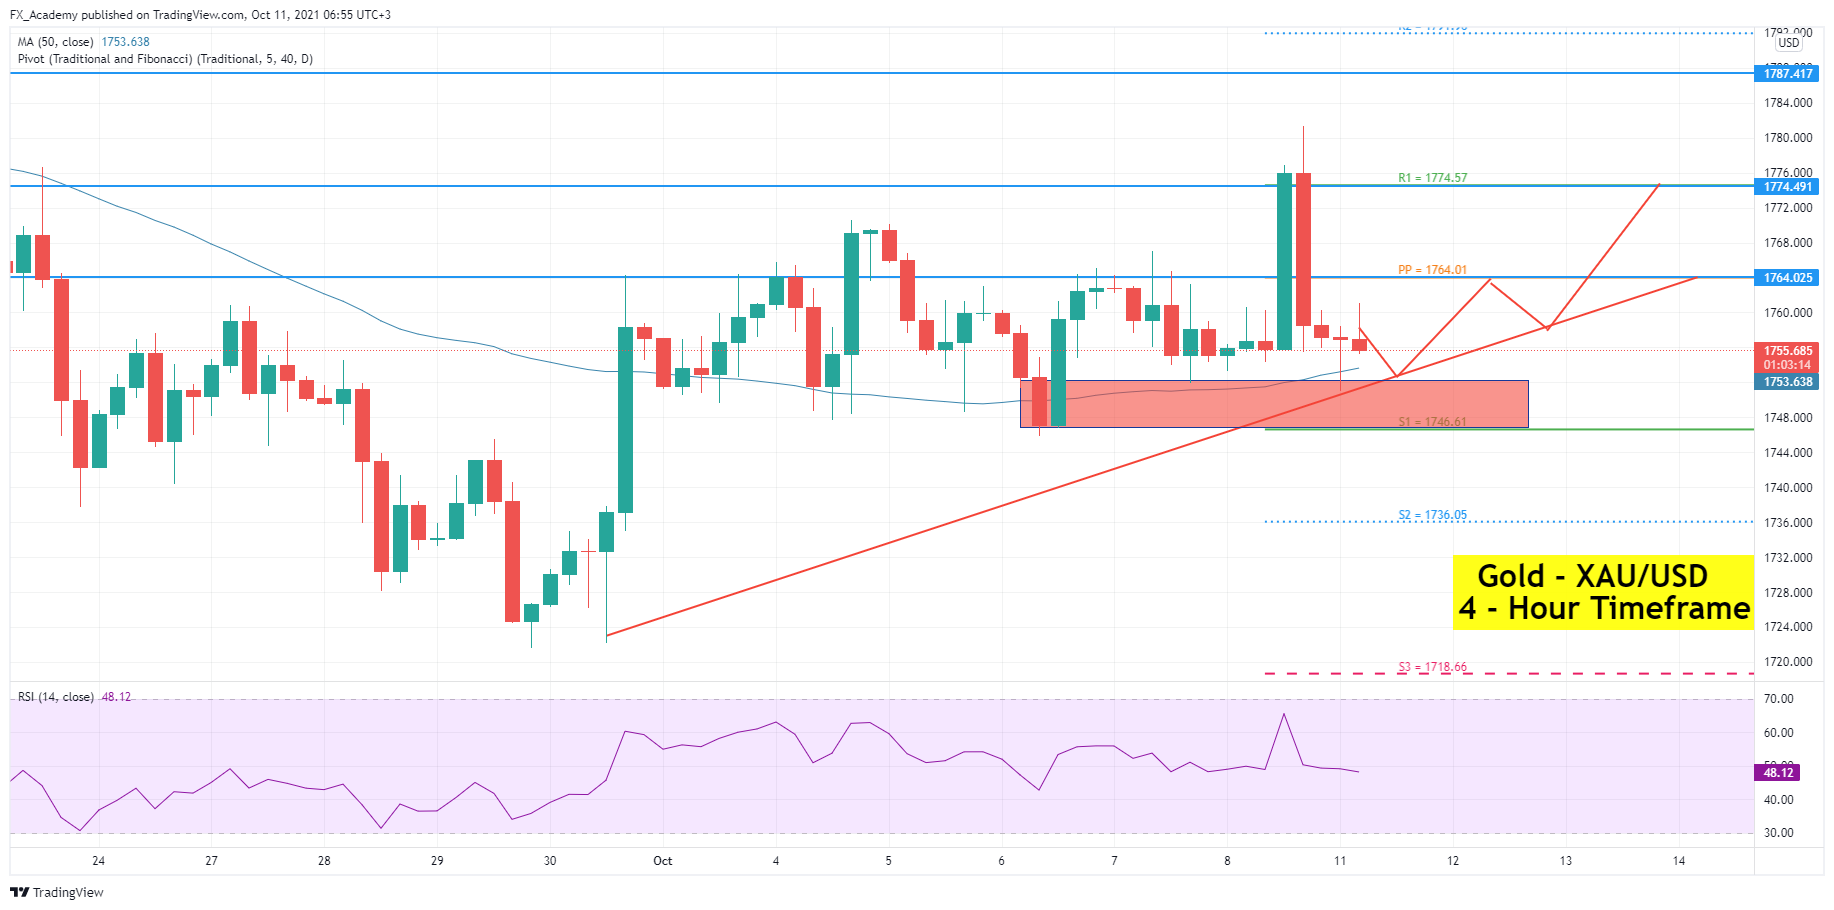
Gold Erases Nonfarm Payroll-driven Gains: All Eyes on $1,753
- Following a tremendous rise to a new 15-day high of $1,781, gold erases nonfarm payroll-driven gains.
- The disappointing jobs report for September pushed gold higher in the market, but the yield spike stopped further gains and dragged yellow metal to the downside.
- On Monday, gold is trading with a neutral bias at the 1,755 level. It holds above an intraday pivot point level of 1,754.
Good morning fellas, and welcome back to another exciting week. It’s going to be another busy five days, amid the minutes of the FOMC Meeting that are due on Wednesday. Following a tremendous rise, to a new 15-day high of $1,781, the XAU/USD pair has lost traction, and gold has erased the nonfarm payroll-driven gains.
Gold prices closed at $1,757.40, after reaching a high of $1,782.40, and a low of $1,753.60. Gold reached its highest level in 12 days on Friday, amid dismal jobs data from the US Labor Department. However, it turned back down, on the back of rising US Treasury yields.
Gold showed movement of about $40 throughout the week, as it appeared to be heading towards the $1,800 level at one point, before returning to the mid-$1,700 level. The US Dollar Index, which measures the value of the greenback against a basket of six major currencies, fell on Friday, coming in at 93.94 and weighing on the US dollar. At 1.61%, the US Treasury yield on a 10-year note reached its highest value since May 30.
Disappointing jobs data – Gold erases the gains driven by the nonfarm payroll
The disappointing jobs report for September pushed gold higher in the market, but the yield spike stopped any further gains, dragging the yellow metal to the downside. The jump in gold prices was driven by the dismal growth in nonfarm payrolls in September, at just 194K versus the expected 500K. It was also short of the previous month’s figure of 235K.
The weak jobs growth in September was a sign that the Federal Reserve might not move ahead with tapering its pandemic-era monthly stimulus of $120 billion in bond purchases. However, there was not only the NFP data release, but also the unemployment rate, which dropped in the same month, providing support for the US dollar and ultimately reducing the gains in the gold prices for the day.
A quick economic outlook
In August, consumer credit fell to 14.4 billion, which was short of the prediction of 17.4 billion. This weighed on the US dollar and supported the gold prices. Meanwhile, the average hourly earnings for September surged by 0.6%, against the expected 0.4%, which supported the US dollar and capitulated the gains in gold even further.
The nonfarm employment change dropped to 194K, against the predicted 490K, and weighed on the US dollar, which, in turn, pushed gold higher. In September, the unemployment rate also dropped, coming in at 4.8%, against the forecast of 5.1%, which supported the US dollar and limited the rise in the gold prices. At 19:00 GMT, the Final Wholesale Inventories were released – they were in line with the expectations of 1.2%.
What’s Next on the Docket?
Furthermore, the US dollar was also lower on board, amid the stalemate on raising the debt ceiling. According to US Treasury Secretary Janet Yellen, the failure to raise the debt ceiling would be catastrophic. On Thursday, the Senate reached a deal to hike the debt ceiling by $480 billion, so that the nation is able to pay its bills through December 3.
Gold price forecast: Daily technical levels.
Support Resistance
1,750.71 1,758.16
1,747.23 1,762.13
1,743.26 1,765.61
Pivot Point: 1,754.68

Gold erases nonfarm payroll-driven gains and is underpinned at $1,746
On Monday, gold is trading with a neutral bias at the 1,755 level. It holds above an intraday pivot point level of 1,754, which is providing a bullish bias for precious metal today.
On the higher side, gold is likely to find immediate resistance at 1,764. Whereas a break-out at the 1,764 level could lead the precious metal prices towards the next resistance levels of 1,773 and 1,779. Furthermore, gold may find immediate support on the bearish side at 1,746. This support is being extended by a double bottom pattern.
Below this pivot point level, the 50-day SMA (simple moving average) provides the next immediate support at 1,751. Let’s consider staying bullish above 1,746 and bearish below the same level on Monday. Good luck!


