Uniswap Showing Bullishness as Fantom Faces Bearish Pressure
Uniswap (UNI/USD) Showing Bullish Signs
Uniswap (UNI/USD) rose from a low of $17 to $26, between September 26 and 27, in a bullish turn that was triggered by high trading volumes. The decentralized crypto trading protocol had been on a losing streak from a high of $31 at the beginning of the month.
The latest surge helped UNI/USD to rise above the resistance at $22. At the time of writing, UNI/USD was trading at $24, just above the current support level. The prices have remained in the green at 7.28% in the last week, but they have gone down by 3.24% in the last 24 hours. If UNI/USD sustains its bullish momentum, it could reclaim its former highs.
China Crackdown Supporting UNI/USD
Decentralized exchanges reaped bigtime after China announced that it will tighten regulations on all virtual assets. The news caused panic in the market, leading to $450 million in liquidations. According to Crypto Briefing, investors seem to have sought shelter in decentralized exchanges, like Uniswap, which have no intermediaries.
– A 4-Hour Chart Analysis
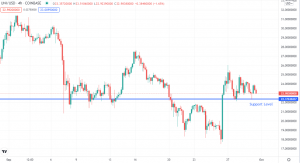
Looking at the 4-hour chart above, the UNI/USD prices have consolidated just above the support level of $22. The market seems to be taking a break after the sharp rise from $17 to $26. From the current level, prices could go higher to claim the previous highs, or alternatively, they could break lower in a bearish downtrend.
– A Daily Chart Analysis
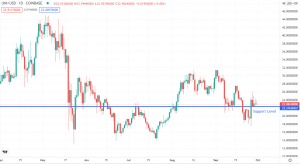
Adding a daily chart gives a further clue on UNI/USD trading. The current consolidation level is an important support where prices have been tested several times. If UNI/USD gets enough buyers, then the crypto token is bound to go higher. The chart shows that it is important to wait for a price action signal to get an idea of the next price movement.
UNI/USD Trade Idea
The fundamentals and technical aspects of UNI/USD are pointing towards a bullish rally. I would watch for a price action signal, like a bullish pin bar or a break from an inside bar to the upside at the current support level, to confirm a buy position. Until then, I would be patient before going short or long.
Should UNI/USD break into a bullish momentum, immediate targets will be at $25, or even the $27 reached on September 16. I would also target levels of $31, or the ATH of 45, based on the prevailing crypto sentiment.
Fantom (FTM/USD) Rejected at 1.2773 Resistance
Bullish on Fantom (FTM/USD)? Well, the crypto token could be on its way to another correction before making any further bullish runs. Whereas FTM/USD is currently consolidating, it is forming bearish signals at the key resistance area around 1.2773, or slightly below it.
– A Daily Chart Technical Outlook
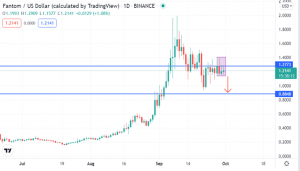
Looking at the daily chart above, we can see that FTM/USD has unsuccessfully attempted to break higher, past the 1.277, which is now acting as a resistance. It is also important to note that FTM/USD has been recovering from the plunge that saw it touch a low of 0.944 on September 21.
At the moment, bearish pin bars have been formed at the resistance level, which means FTM/USD could slide lower from the current consolidation.
FTM/USD Trade Idea
Although I see a potential bullish momentum developing in FTM/USD, I would wait for prices to break sufficiently above the 1.2773 level, before entering a buy trade. A break above the resistance, followed by the formation of bullish price signals, would open a buy trade, with targets at 1.48 and 1.70, and potentially at the all-time high around 1.9. Good luck!


