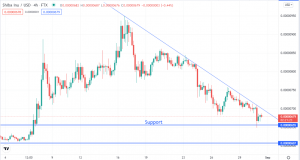
Shiba Inu (SHIB/USD) Reaches the 0.0000065 Support. What Next?
After remaining on a downtrend since August 16, Shiba Inu (SHIB/USD) is now back to where it all began. In our previous outlook, we projected that SHIB/USD would reach a low of 0.00000655. In the analysis, we pointed to the technical indicators that showed a bearish momentum.
Declining investor interest was also linked to the plunge in Shiba Inu, with the crypto’s total value locked (TVL) having dropped to slightly below $350 million as of August 26, which was down from more than $1 billion in a month. At the time of writing, Shiba Inu’s TVL had plunged further to $342.14 million. This shows that the cryptocurrency is still experiencing investor outflows, with limited influencer mentions also taking some of the blame.
The results are now there to see. SHIB/USD has wiped all the gains it had gathered since August 7 and is sitting slightly above the support of 0.00000655. The crypto token is currently trading at 0.00000670, down from the high of 0.0000095 it reached on August 16.
The 0.00000655 support is where SHIB/USD broke above the consolidation area before it began a new bullish momentum. Thus, it is a make-or-break level, and a further decline could see it enter another lasting consolidation, potentially regaining the low at 0.00000607.
Below, you can have a technical look at SHIB/USD trading.
SHIB/USD – A Technical Outlook

Shiba Inu 4-Hour Chart Analysis
From the 4-hour chart, SHIB/USD can be seen rebounding from the 0.00000655 support after testing it. However, it is still trapped on a descending trendline. Together with the support level, the trendline forms a descending triangle, which means that the bearish momentum is far from over.
SHIB/USD Trade Analysis and Trade Idea
Formation of bullish trade signals at the 0.00000655 support will signal a buy on SHIB/USD. However, I am keen to see if the crypto token breaks above the descending trendline and descending triangle for trade confirmation. I am also interested in SHIB/USD’s TVL as it has proven to have a major impact on the price.
Buy entries should target the area around 0.00000707, and potentially higher at 0.00000751.
If SHIB/USD fails to break above the descending trendline, I will watch for the next support at 0.00000607.


