MAs Have Turned Into Support for Shiba Inu, Suggesting a Trend Reversal in SHIB/USD
Shiba Inu seems to have turned bullish, as moving averages are turning from resistance into support
The Shiba Inu coin has been under immense pressure since May, but it might have turned around now, and survived the big crash. In fact, SHIB/USD might have left the difficult times behind, and it could be resuming the larger bullish trend in the meantime.
The price still has some room to cover until it climbs above the May and June highs, but at least the indicators that were keeping it down, as shown on the chart above, are now keeping it up. As we reported in our Shiba forecast for 2021, moving averages were killing every retrace up during the bearish trend of the last few months, while now they have turned into support.
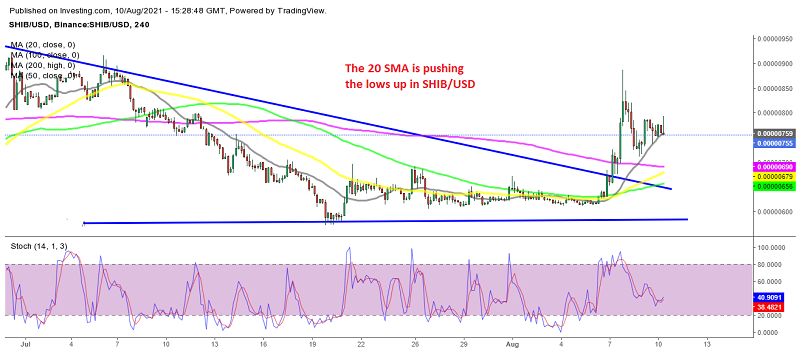
Looking at the H4 chart at the top of this article, we can see that the 100 SMA (green) was providing resistance for SHIB/USD from late July, pushing the highs lower. However, that moving average was broken on Sunday, when the price jumped higher, on the back of rumours of a coin-burn by Shiba Inu, which would remove a number of Shiba coins from circulation. Now the 20 SMA (gray) has turned into support, pushing the lows higher, which suggests that the buying pressure is strong, since buyers are jumping at the first opportunity.
Shiba Inu Live Chart
On the daily chart below, we see that the 50 SMA (yellow) and the 100 SMA (green) were keeping the price down after the crash, together with the declining upper line of the triangle. We predicted that the triangle was going to break soon, which it did to the upside after the pop on Saturday.
Now the 50 SMA has turned into support and Shiba Inu has been holding above it for a few days. So, the previous resistance indicators are holding as support now, which is a great sign for Shiba Inu buyers. We might actually go long on SHIB/USD ourselves, but will wait for a retrace lower, to around $0.0000070, which would offer a better risk/reward (R/R) ratio.

The 50 SMA is keeping Shiba Inu up on the daily chart
- Check out our free forex signals
- Follow the top economic events on FX Leaders economic calendar
- Trade better, discover more Forex Trading Strategies
- Open a FREE Trading Account
Related Articles
Comments
Sidebar rates
Related Posts
