AUD/USD Challenging MAs as it Moves Higher, Following the Soft US ADP Jobs Report
The AUD/USD stopped making new highs after it reached the big round level at 0.80 back in February, but the real decline started in the second week of June, when this pair started a tumble of around 17 cents from the top. The decline was quite fast in June and July, as Australia got deeper into the rabbit hole, with restrictions and lockdowns due to the coronavirus, which still are still in place Down Under.
That kept the Reserve Bank of Australia (RBA) on a dovish footing, while the FED, on the other hand, started to look into tapering its monetary policy, with the US economy booming, employment growing pretty fast and inflation surging. On the contrary, the AUD/USD was falling and the 20 SMA (gray) was pushing the price down, which showed the strong pace of the decline.
AUD/USD Live Chart
Now, however, we are seeing that this pair is moving above the 20 daily SMA after the US ADP employment figures came to half of what was expected for July, pushing the USD down and the AUD/USD up. So, we’re seeing a decent pullback after such a selloff in the last two months, but this is a good opportunity to look at selling this pair, since fundamentals point down for it.
US July ADP Non-Farm Employment Report
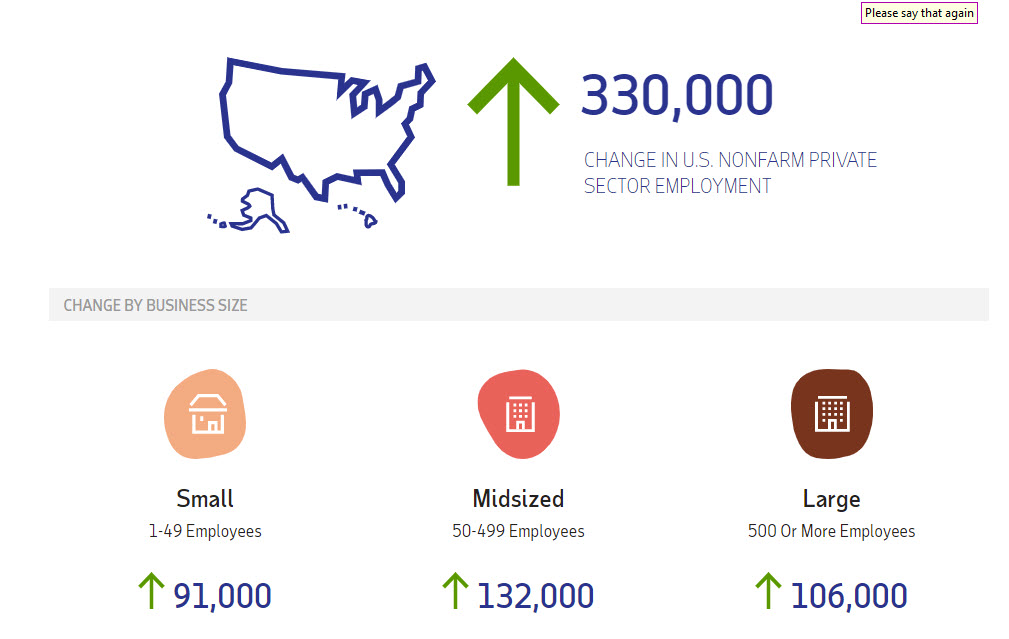
- US July ADP non-farm employment at 330K vs 695K expected
- June DP jobs came in at 692K (revised to 680K)
ADP Details:
- Small businesses added 92K
- Mid-sized 132K
- Larger 106K
- Goods sector 12K
- Service sector 318K
- Leisure and hospitality plus 139K
- Education and health services +64K
- Professional/business services +54K
- Trade/transportation/utilities +36K
- Financial activities +9K


Sidebar rates
Related Posts
