Monero (XMR) Daily Chart Setup Looks Promising for Buyers
Monero is starting to bounce off the 200 daily SMA after a hammer candlestick yesterday
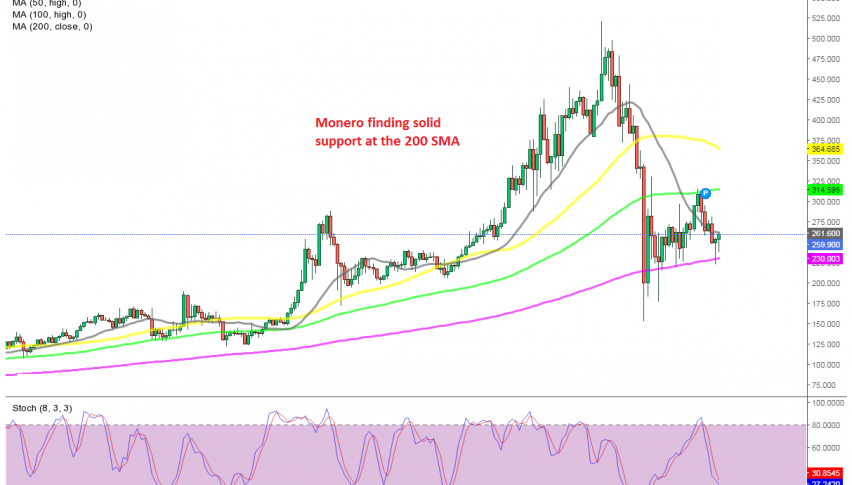
In May, Monero went through a major crash like all other cryptos, losing around 70% of its value as it crashed from $520 to $152. Sellers pushed below the 200 SMA (purple) which was the last obstacle on the daily chart for the XMR/USD.
But, the price pulled back up above it, where it has been trading for about three weeks. There have been attempts to reverse the trend, but the 100 SMA (green) has been providing resistance at the top, which has been keeping this pair confined within this range.
But the situation for Monero seems much better than for most other cryptocurrencies. Monero had a decent attempt at turning bullish last week, while most cryptos remained stagnant. This week the sentiment turned negative again in the crypto market, which dragged the XMR/USD down as well.
Monero Live Chart
But, the decline ended right at the 200 SMA (purple) on this chart. The daily candlestick closed as a hammer, which is a strong bullish sign after the decline, and today’s candlestick looks bullish as well. So, the chart setup here points to a bullish reversal, but the 20 SMA (gray) is acting as resistance now. However, the real test will be the 100 SMA higher, if buyers push above the 20 SMA soon.
- Check out our free forex signals
- Follow the top economic events on FX Leaders economic calendar
- Trade better, discover more Forex Trading Strategies
- Open a FREE Trading Account
Related Articles


Comments
Sidebar rates
Related Posts
