Ethereum Price Forecast – ETH/USD Gains Support at $2,528 – Is It Going After $2,900?
The ETH/USD was closed at $2633.30 after placing a high of$2730.19 and a low of $2568.20. Like all other cryptocurrencies, ETH/USD dropped o
Arslan Butt•Wednesday, June 2, 2021•2 min read

The ETH/USD closed at $2,633.30, after placing a high of $2,730.19, and a low of $2,568.20. Like all other cryptocurrencies, the ETH/USD dropped on Tuesday, following the decline in leading currency and the strength of the US dollar. The average transaction costs on the two largest blockchains, including Bitcoin and Ethereum, dropped to their lowest level in six months, after the latest market crash and recovery attempts. The Ethereum network became synonymous with high fees, following the substantial boost in Defi, NFTs and other operations running on top of it.
According to statistics, the Eth2 deposit contract has more than 5.2M staked ether worth over $13 billion locked into the smart contract. The contract launched on November 4, 2020, and after just three weeks, the contract met the required threshold to initiate the Beacon Chain. Meanwhile, the declining prices of the ETH/USD on Tuesday could also be attributed to the losses incurred by the BTC/USD on the day. The largest cryptocurrency has a strong influence over the whole market and tends to move the market in its direction. Bitcoin came under pressure on Tuesday, amid various negative developments and the rising prices of the US dollar.
Bitcoin was under pressure, because the governor of the central bank of Sweden, Stefan Ingves, argued on Tuesday that Bitcoin has become too big an asset to escape regulatory frameworks. This came in as the country was set to implement tighter rules for cryptocurrency exchanges. These comments put additional pressure on the
BTC/USD, dragging its prices and weighing on the cryptocurrency market.The US dollar was strong onboard on Tuesday, amid the stronger-than-expected PMI data release. At 18:45 GMT, the Final Manufacturing PMI was released. It indicated an advance to 62.1, against the anticipated 61.5, supporting the US dollar and putting pressure on the
ETH/USD. At 19:00 GMT, the ISM Manufacturing PMI came in, showing an improvement to 61.2, against the predicted 60.8, which supported the greenback and weighed on the
ETH/USD.

ETH/USD Daily Technical Levels
Support Resistance
2,557.61 2,719.60
2,481.91 2,805.89
2,395.62 2,881.59
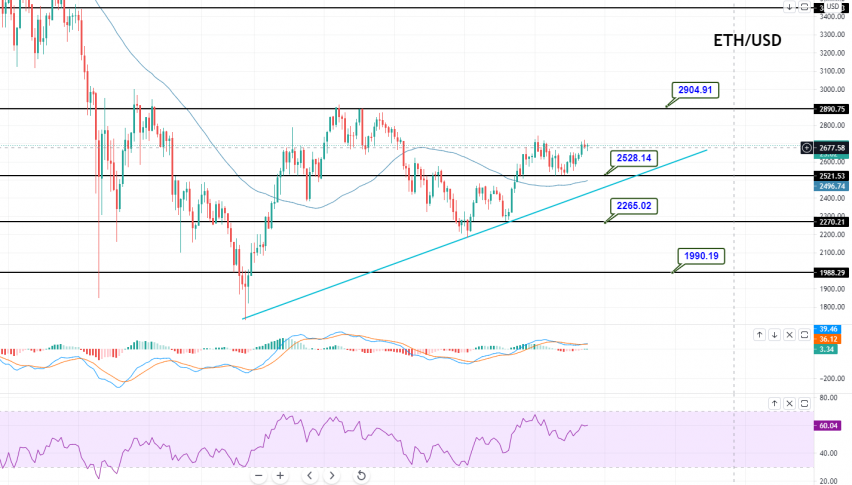
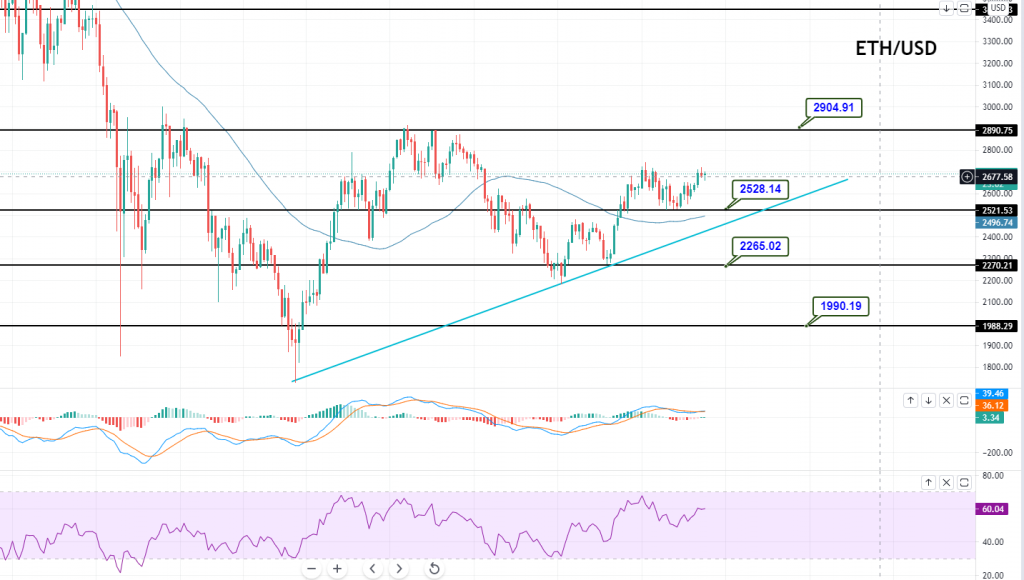
Pivot Point: 2,643.90The
ETH/USD is trading slightly bullishly at the 2,693 level, and facing resistance at the 2,700 level. On the 4-hour chart, the pair has formed a sideways trading range between 2,700 and 2,528. On the lower side, the support continues to hold at around 2,528. A bearish crossover at 2,528 opens up additional room for selling until the next support areas of 2,265 and 1,953. The RSI and MACD indicators support the bullish trend in Ethereum. The idea is to stay bullish upon the breakout of the 2,700 resistance areas today, to target the 2,904 level. Good luck!
Arslan Butt
Index & Commodity Analyst
Arslan Butt serves as the Lead Commodities and Indices Analyst, bringing a wealth of expertise to the field. With an MBA in Behavioral Finance and active progress towards a Ph.D., Arslan possesses a deep understanding of market dynamics.His professional journey includes a significant role as a senior analyst at a leading brokerage firm, complementing his extensive experience as a market analyst and day trader. Adept in educating others, Arslan has a commendable track record as an instructor and public speaker.His incisive analyses, particularly within the realms of cryptocurrency and forex markets, are showcased across esteemed financial publications such as ForexCrunch, InsideBitcoins, and EconomyWatch, solidifying his reputation in the financial community.
Related Articles