A Triangle Forming in Bitcoin, As the 100 SMA Keeps Pushing It Up
Bitcoin is narrowing the range, as highs get lower and lows get higher
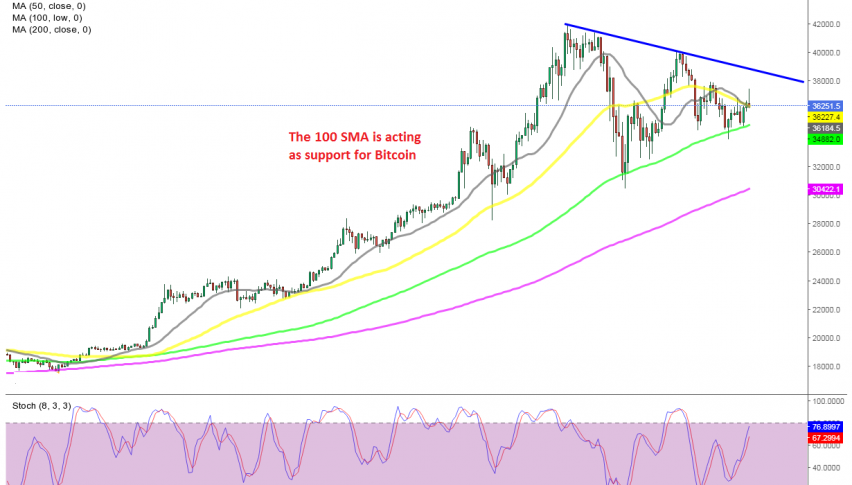
Cryptocurrencies turned massively bullish in 2020 and in the last several months they have been absolutely surging higher. Bitcoin broke above the big resistance level at $ 20,000 and made new record highs as it moved above $ 42,000 in the first week of 2021.
But, the surged ended back then and cryptocurrencies retreated lower, with BITCOIN falling to $ 30,400s, in a flash crash. Although the 100 SMA (green) didn’t give up; it held as support despite being pierced. The H4 candlesticks didn’t close below that moving average, which means that there was no break of it.
Th price bounced of that moving average and it climbed to $ 40,000 again, although after finding resistance at the 50 SMA (yellow) initially. We have seen quite a few bearish reversals since then, with the highs getting lower, while at the bottom the lows are getting higher, as the 100 SMA keeps moving higher, pushing pullbacks higher. Now Bitcoin is reversing down after moving higher earlier today. We will wait for the price to reach the 100 SMA and will probably go long from there, if the 100 SMA acts as support again.
- Check out our free forex signals
- Follow the top economic events on FX Leaders economic calendar
- Trade better, discover more Forex Trading Strategies
- Open a FREE Trading Account
Related Articles


Comments
Sidebar rates
Related Posts
