The Tide Changes in Gold, As MAs Turn into Resistance Again
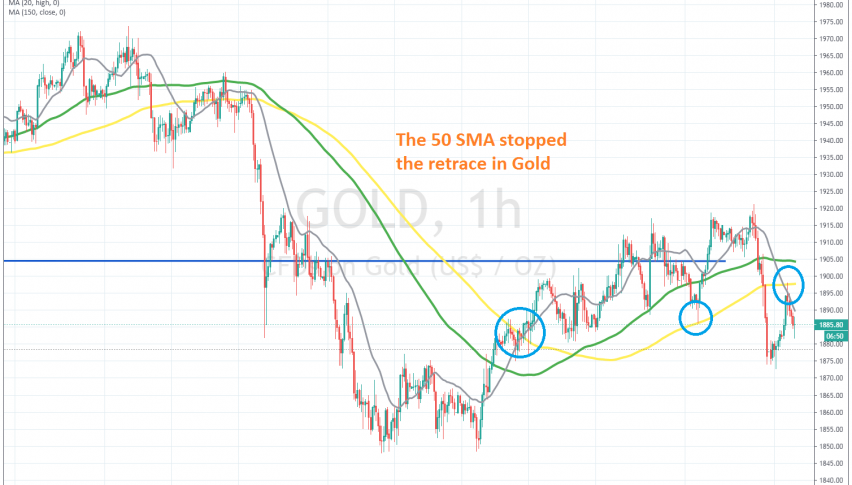
Gold retraced higher today, but the 50 SMA stopped the climb and reversed it down
GOLD climbed above $ 2,000 in August, but failed to remain above that level for long. It reversed back down, but the real decline came in September, as the USD recuperated some of its losses. The price fell to $ 1,840, but it reversed higher in the last week of September.
The 100 SMA held as support on the daily time-frame chart, and also it held earlier today, as the price turned lower. Since the last week of September, the gold price has been retracing higher, and moving averages have turned into support on the H1 chart.
But the 20 daily SMA stopped its climb yesterday, as the sentiment improved during the US session. Gold declined nearly 500 pips yesterday, as safe havens crashed lower, but it retraced higher during the Asian session today. However, the retrace ended at $ 1,898, where the 50 SMA (yellow) was standing on the H1 chart, which shows that the pressure is shifting to the downside for gold. So, we will try to sell retraces higher in Gold, as long as the bias remains bearish.
- Check out our free forex signals
- Follow the top economic events on FX Leaders economic calendar
- Trade better, discover more Forex Trading Strategies
- Open a FREE Trading Account
Related Articles


Comments
Sidebar rates
Related Posts
