Crude Oil Violates Sideways Range – Get Ready for Buying Signal
WTI crude oil prices dropped once again due to the Energy Information Administration (EIA) showed the unexpectedly more significant...
During the Asian session, WTI crude oil prices dropped once again due to the Energy Information Administration (EIA) report which showed unexpectedly more significant increase in US crude oil stockpiles, whereas the weak China GDP growth also sent prices lower.
WTI crude inventories climbed 9.3 million barrels last week, the Energy Information Administration (EIA) reported. On the other hand, the Gasoline stockpiles dropped by 2.56 million barrels, against expectations of 1.21 million barrels. Distillate stockpiles declined by 3.8 million barrels, against the forecast figures fall of about 2.4 million barrels.
In the 3rd quarter, China’s economic growth declined to 6% YoY, which is also putting bearish pressure on crude oil prices. It should be noted that OPEC and its partners agreed to cut their crude oil production by 1.2 million barrels per day till March 2020.
WTI Crude Oil – Technical Outlook
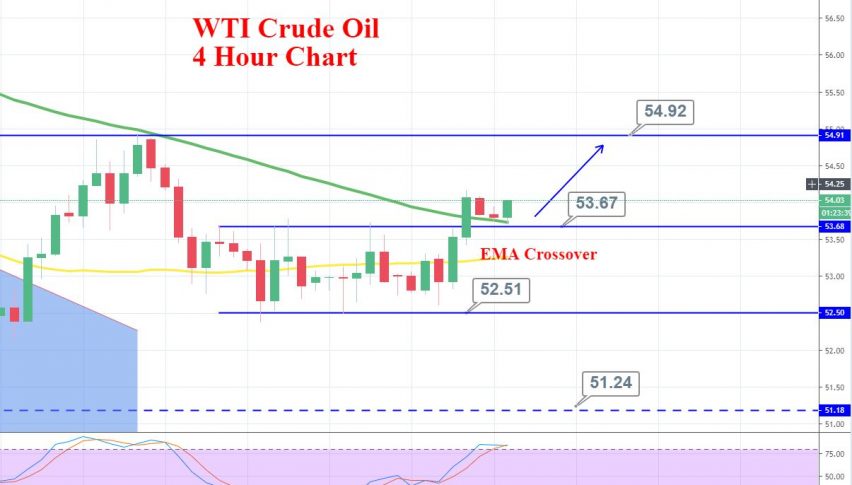
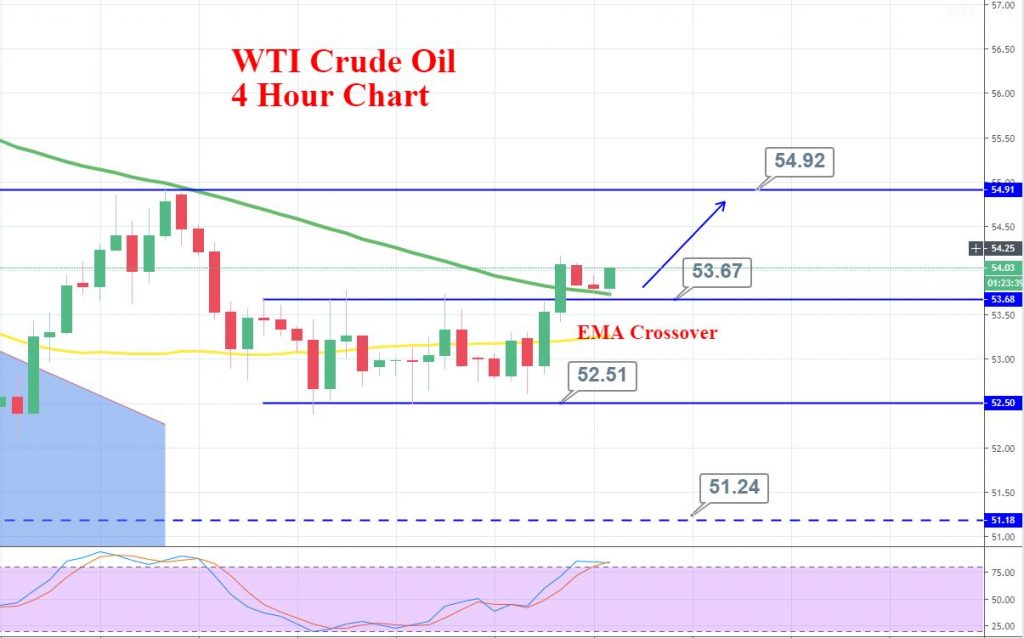
On the technical side, crude oil has come out of the narrow trading range of 53.70 – 52.50. Closing of Doji candle outside this range is confirming the bullish breakout on a 4-hour chart.
At the same time, crude oil has also crossed over 50 periods EMA, which is signaling chances of further buying in the WTI.
On the upper side, crude may find the next resistance at 54.90 while support stays at 53.60.
Daily Support and Resistance
S3 50.65
S2 52.18
S1 53.18
Pivot Point 53.72
R1 54.72
R2 55.25
R3 56.78
WTI Crude Oil – Forex Trading Signal
The idea is to stay bullish above 53.65 with a stop loss below 53.35 and take profit at 54.25.
Good luck!
- Check out our free forex signals
- Follow the top economic events on FX Leaders economic calendar
- Trade better, discover more Forex Trading Strategies
- Open a FREE Trading Account
Related Articles


Comments
Sidebar rates
Related Posts
