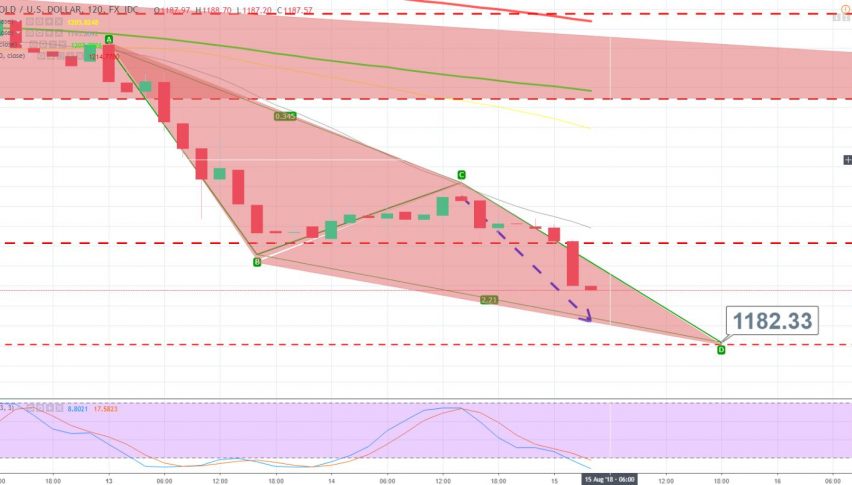
ABCD pattern in Gold – Is it going for $1,181?


Today during the early Asian session, gold prices slid to their lowest since January 2017, pressured as the dollar index soared to its highest in 13 months. No surprises here, it’s exactly what we suggested in our previous update Aug 14 – Economic Event Brief.
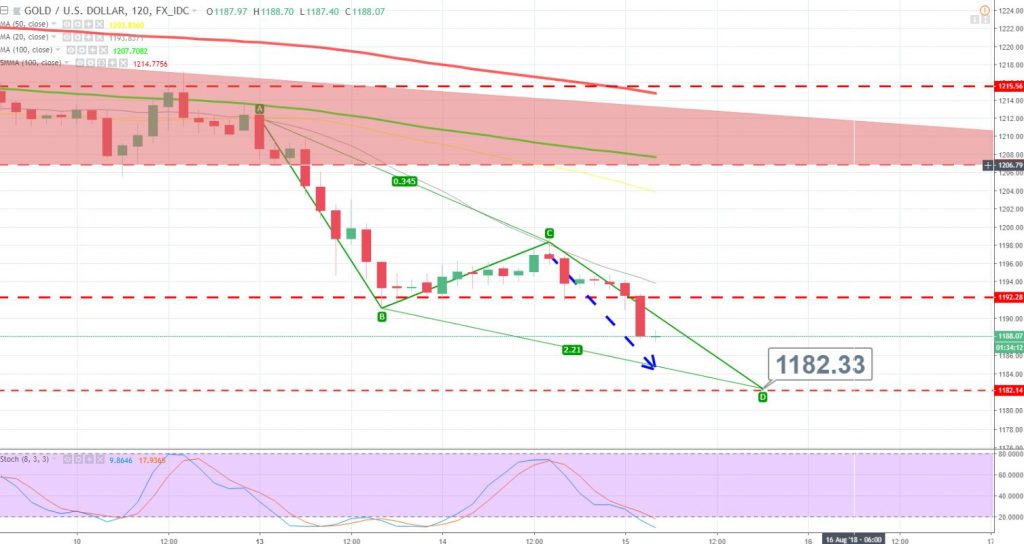
Gold – 2 Hour Chart
Gold seems to form an ABCD pattern on the 2-hour chart. As you can see, it has complete 38.2% retracement near $1,198 and has also violated the major support zone of $1,192.
The recent bearish engulfing candle is suggesting a strong bearish sentiment of traders and it has nice chances to go after $1,187 and $1,181.
Check out our free forex signals
Follow the top economic events on FX Leaders economic calendar
Trade better, discover more Forex Trading Strategies
Related Articles


Comments
Subscribe
Login
Please login to comment
0 Comments
Oldest