A Quick Look At The EUR/USD Weekly Chart
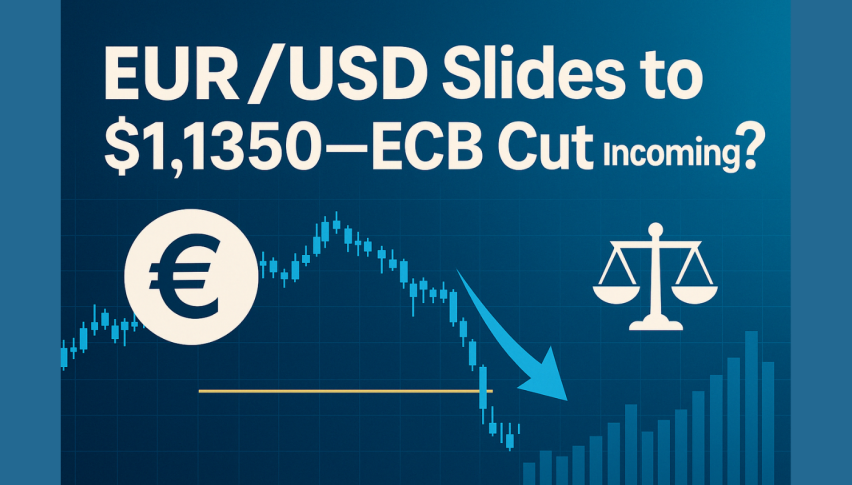
The downtrend in the EUR/USD becomes obvious with one glance at the weekly chart, with price falling dramatically since April.

The late Spring and early Summer months have not been kind to EUR/USD bulls. Prices have consistently slipped amid a cycle of tightening by the U.S. Federal Reserve (FED) and dovish overtones from the European Central Bank (ECB). The result has been extended pain for longs, as values have fallen from 1.2500 to 1.1500. Can anything change the bearish dynamic for the remainder of 2018?
Key Events
Market fundamentals are the only thing that may shift the prevailing negative sentiment. As always, a quick look at the economic calendar is a good place to start when attempting to find a market’s turning point. Here are the key events facing the EUR/USD for the coming week:
Country Event Day
China GDP Sunday
U.S./Russia Trump/Putin Meeting Monday
U.S. Retail Sales Monday
U.S. FED Powell Speech Tuesday
E.U. CPI Wednesday
This week is a big one on the geopolitical front. The Trump/Putin meeting will grab headlines, with WTI crude pricing being on the front burner. Not much is expected from the conference, but anything can happen and volatility is likely for Monday’s session.
China’s GDP is a key number that investors will be watching closely. Although it is too soon for the impact of U.S. tariffs to be seen in the Chinese manufacturing sector, traders are certainly curious about China’s economic health.
Eurozone CPI is a biggie for the EUR/USD, with the industry consensus expecting it to remain unchanged at 1%. As always, currency traders will be watching closely, looking for any signs that the ECB may adopt a more hawkish stance in coming months.
EUR/USD Weekly Chart
The downtrend in the EUR/USD becomes obvious with one glance at the weekly chart. Prices have fallen dramatically since April, with 1.1500 being the late-June bottom.
++16_2017+-+28_2018.jpg)
Converging indicators are a good thing and we have two key technical levels near the 1.1900 handle. Here they are:
- Resistance(1): Bollinger MP, 1.1894
- Resistance(2): 38% Retracement, 1.1908
Overview: The EUR/USD settled last week just beneath the 1.1700 handle. The bearish bias is confirmed, as price has not violated the 38% retracement of 2018’s sell-off. As of now, the downtrend remains valid.
The 1.1900 handle will loom large in coming weeks. At some point, this market will rally and test 1.1900, likely by the Fall. When it does, we will be ready to go short and take some green pips out of this market!
- Check out our free forex signals
- Follow the top economic events on FX Leaders economic calendar
- Trade better, discover more Forex Trading Strategies
- Open a FREE Trading Account


