


Double Top Pattern in EUR/USD – Brake Moving Average
Last Friday, the EUR/USD turned downward after breaking above January’s high very briefly. Since then, this pair has been on a bearish short-term trend, while the bigger trend remains bullish.
There’s a case here for a double top chart pattern. The EUR/USD has made two tops near 1.2550 this year and has reversed back from there, telling us there is strong selling pressure up there.
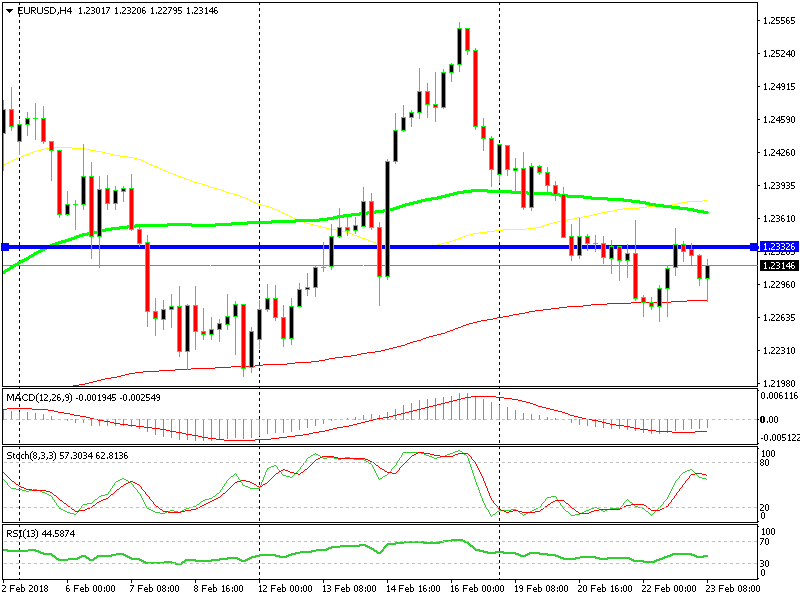
The 100 SMA providing support
Sellers must break below the neckline of the head and shoulder pattern should this chart pattern succeed. The neckline comes in at 1.22, which was low at the beginning of the month.
If sellers do manage to push below that moving average, the target should land around 1.1850.
The Moving Average
There’s a technical indicator providing support for this pair for several weeks. According to the chart, the 100 SMA (red) stopped the decline now and about two weeks ago.
If the sellers want to take control, they have to push below this moving average. Once the neckline has been broken, the double top trade is to sell. However, selling when the 100 SMA breaks, offers a better risk/reward ratio.


Sidebar rates
Related Posts
Add 3440

