Crypto Strategy: Cryptocurrency Technical Analysis
Last Update: October 28th, 2024

Technical analysis is the study of past and present price action to determine future market behavior. It is an exceedingly popular way of crafting trade-related decisions for short, medium, and long-term crypto market participants, often utilizing advanced technical analysis tools. And, although technical analysis isn’t fool proof, it can be an invaluable tool for engaging the fast-moving cryptocurrency atmosphere.
At FX Leaders, we furnish active traders around the world with live rates and real-time charts ― two indispensable tools for conducting astute technical analysis.
In addition, our team of experts breaks down the key cryptocurrencies of the day, posting intermediate-term forecasts and live updates as key events happen. If you’re a serious crypto trader, then look no further than the technical analysis suite at FX Leaders.
What Are Live Crypto Rates?
At its core, technical analysis is the study of price. So, before you can become a crypto market technician, you need access to pricing data. The average price is a critical reference point in technical analysis, helping traders identify market conditions such as overbought or oversold situations. Fortunately, our Live Rates portal has you covered.
Driven by market-direct streaming data, Live Rates is an all-in-one window to the world of finance. Featuring quotes on the hottest forex, commodity, index, and crypto products, Live Rates furnishes users with timely price changes and market developments. No longer will you miss out on opportunity; asset prices are updated in real-time, on a user-friendly interface.
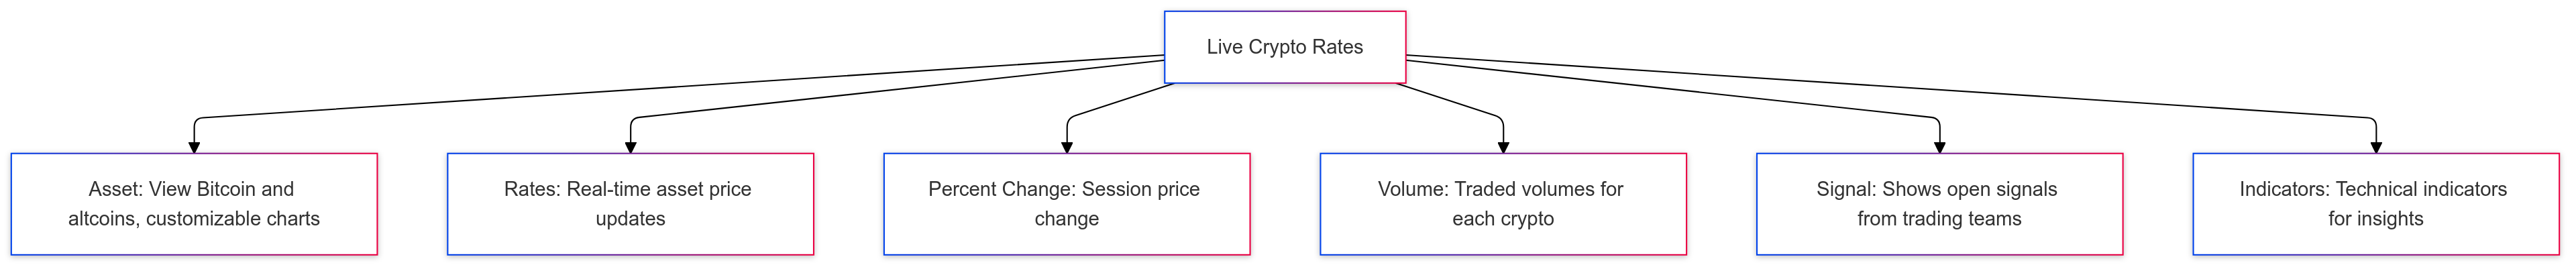
Below are the key data sets available on the cryptocurrency Live Rates page:
- Asset: View the evolving conditions for Bitcoin, as well as an extensive list of altcoins. If you don’t see your favorite, simply type the coin’s name into the Search Live Rates bar. Click on a desired product and open a fully-customisable dynamic price chart.
- Rates: Asset prices are constantly updated to reflect any and all changes taking place in the market.
- Percent (%) Change: The session’s percentage change in asset pricing is listed in an intuitive format ― green for positive, red for negative.
- Volume: Intra-session traded volumes for each crypto are listed and updated.
- Signal: Quickly see if the FX Leaders team has an open signal in one or more cryptos.
- Indicators: Get in on the action with market reads from live market crypto indicators.
No matter what your technical approach to the crypto markets is, be sure to kick off your analysis with a trip to the FX Leaders Live Rates market portal.
What is Technical Analysis in Crypto?
Technical analysis in crypto refers to the study of past price movements and market data to forecast future price movements. By analyzing charts, patterns, and trends, traders can identify potential trading opportunities. The core idea behind technical analysis is that market prices reflect all available information.
Therefore, by scrutinizing this information, traders can make informed decisions about buying or selling cryptocurrencies. Whether you’re a seasoned trader or a newcomer, understanding technical analysis can significantly enhance your ability to navigate the volatile crypto market.
Benefits of Technical Analysis in Crypto Trading
Technical analysis offers several benefits to crypto traders, making it an indispensable tool in the trading arsenal:
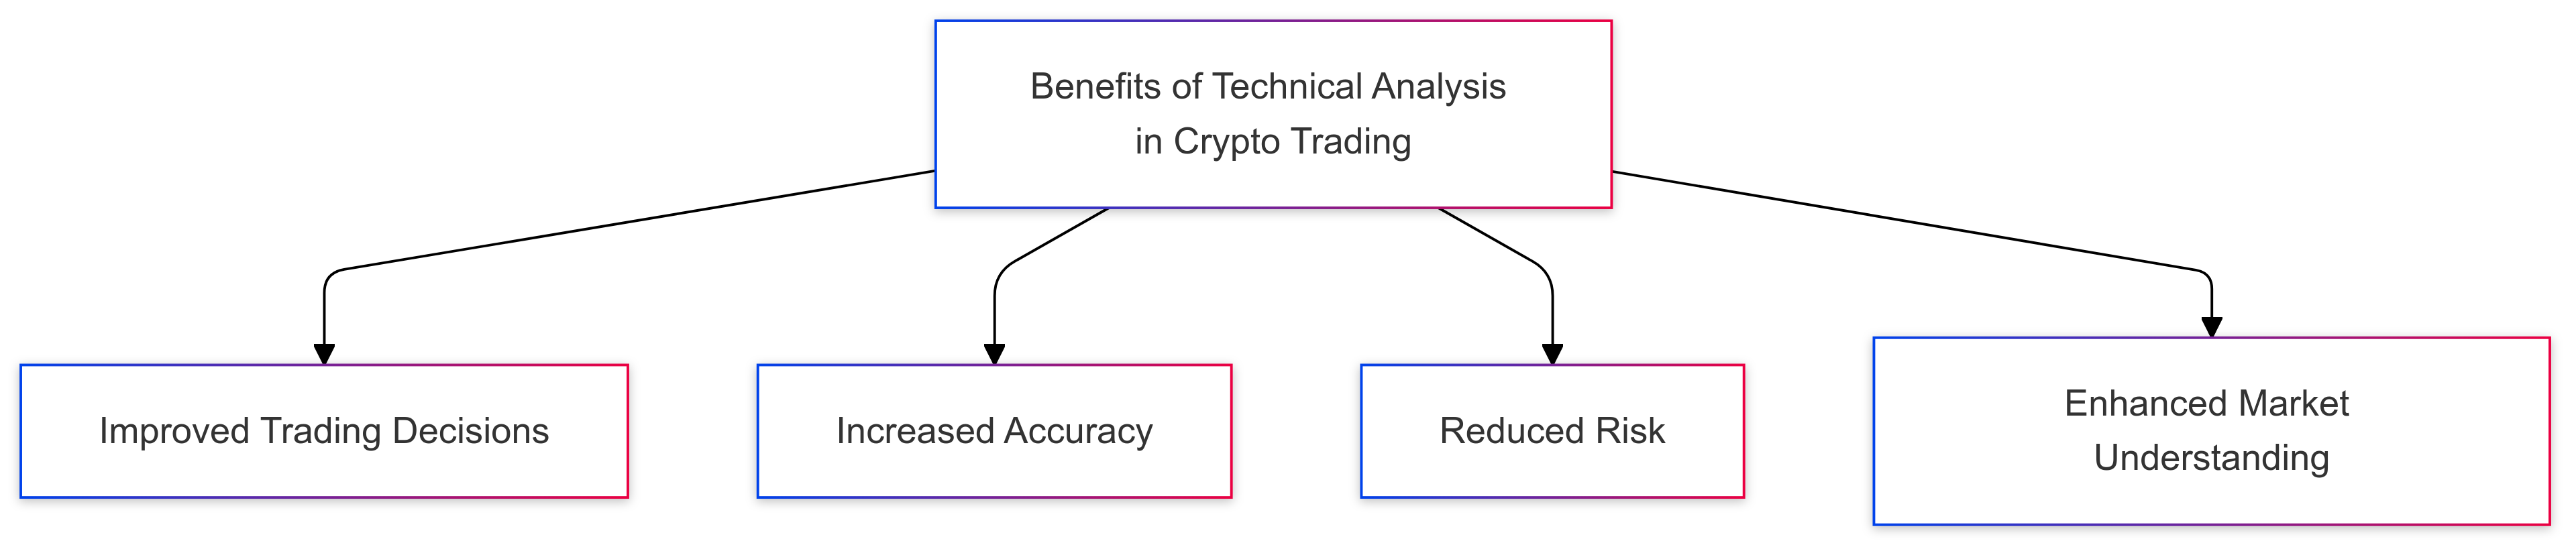
- Improved Trading Decisions: By analyzing charts and patterns, traders can make more informed decisions about buying or selling cryptocurrencies.
- Increased Accuracy: Technical analysis helps traders identify trends and patterns that may not be immediately apparent, increasing the accuracy of their trading decisions.
- Reduced Risk: By identifying potential support and resistance levels, traders can implement risk management strategies to minimize losses.
- Enhanced Market Understanding: Technical analysis aids traders in understanding market trends and sentiment, allowing them to make more informed decisions.
Incorporating technical analysis into your trading strategy can lead to more precise and confident trading decisions, ultimately improving your overall trading performance.
How To Use Crypto Charts
For practitioners of technical analysis, the pricing chart is “the window to the marketplace.” It clearly illustrates price action, present and past, in a visual format.
Historical data is crucial for backtesting trading strategies and performing technical analysis, as it allows traders to simulate past market conditions and refine their strategies.
Although they come in a variety of unique types, all crypto pricing charts have one essential function ― they plot streaming price data graphically.
The Crypto Charts page at FX Leaders is a collection of historical analysis and live cryptocurrency pricing charts for the most popular coins. Below are a few of the key features:
- Diverse Lineup Of Coins: Crypto Charts covers the biggest names in the cryptosphere as well as the leading altcoins. Included are Bitcoin (BTC), NEO (NEO), Polkadot (DOT), Binance Coin (BNB), Tezos (XTZ), Ethereum (ETH), EOS (EOS), Cardano (ADA), and Ripple (XRP). Don’t see the coin you are looking for? Check back soon as Crypto Charts is regularly updated.
- Key Fundamentals: Our team of market analysts goes into vast detail on the background and fundamentals vital to each cryptocurrency on the Crypto Charts page. Simply click on a featured coin and read about the key underpinnings that have driven price and what may impact future values.
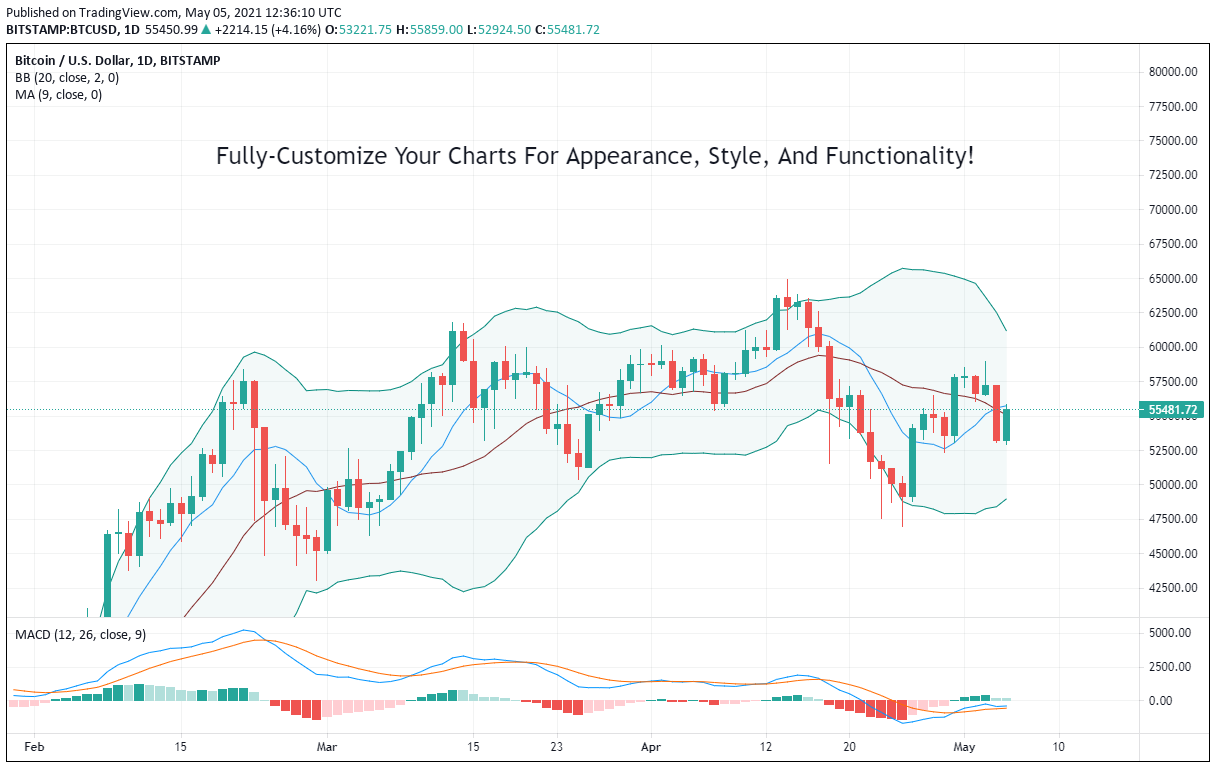
- Live Chart: Every featured crypto page comes with a dynamic pricing chart. Customize your study by selecting a desirable duration and scale.
If you’re a crypto market technician, or aspire to become one, Crypto Charts at FX Leaders is a convenient, valuable educational tool.
Technical Indicators for Crypto Trading
Technical indicators are mathematical calculations based on historical price data that help traders identify trends and patterns. Some popular technical indicators used in crypto trading include:
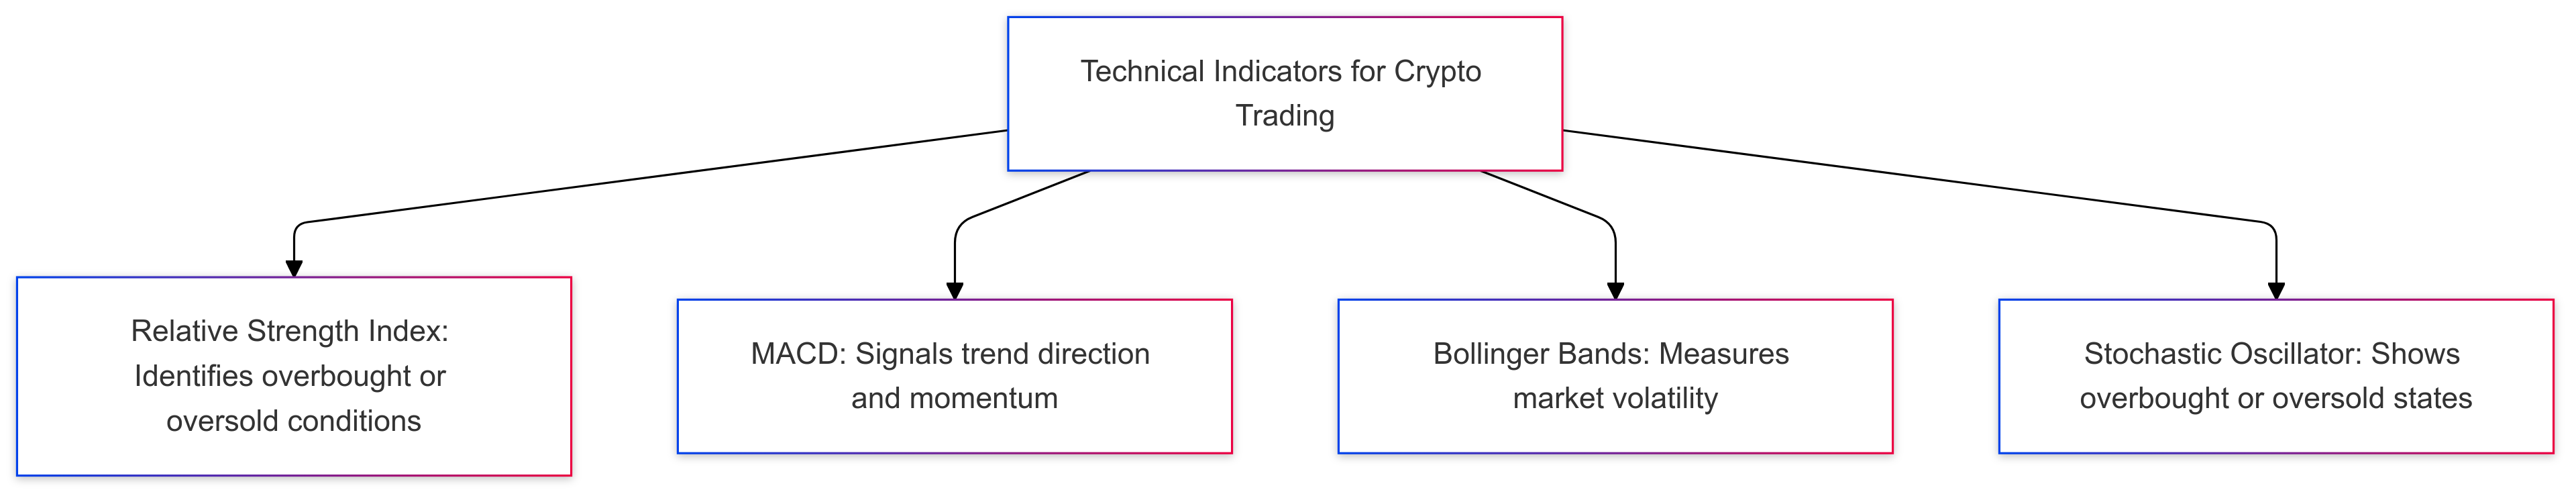
- Relative Strength Index (RSI): Measures the magnitude of recent price changes to determine overbought or oversold conditions. The RSI helps traders identify potential reversal points in the market.
- Moving Average Convergence Divergence (MACD): Plots the difference between two moving averages to identify trends and potential buy or sell signals. The MACD is a versatile indicator that can signal both trend direction and momentum.
- Bollinger Bands: Measures volatility by plotting two standard deviations above and below a moving average. Bollinger Bands help traders identify periods of high or low volatility and potential price breakouts.
- Stochastic Oscillator: Compares the closing price to its price range over a given period to identify overbought or oversold conditions. This indicator is useful for spotting potential reversal points in the market.
By incorporating these technical indicators into your analysis, you can gain deeper insights into market trends and make more informed trading decisions.
Chart Patterns and Formations
Chart patterns and formations are visual representations of price movements that can help traders identify trends and potential trading opportunities. Some common chart patterns and formations used in crypto trading include:
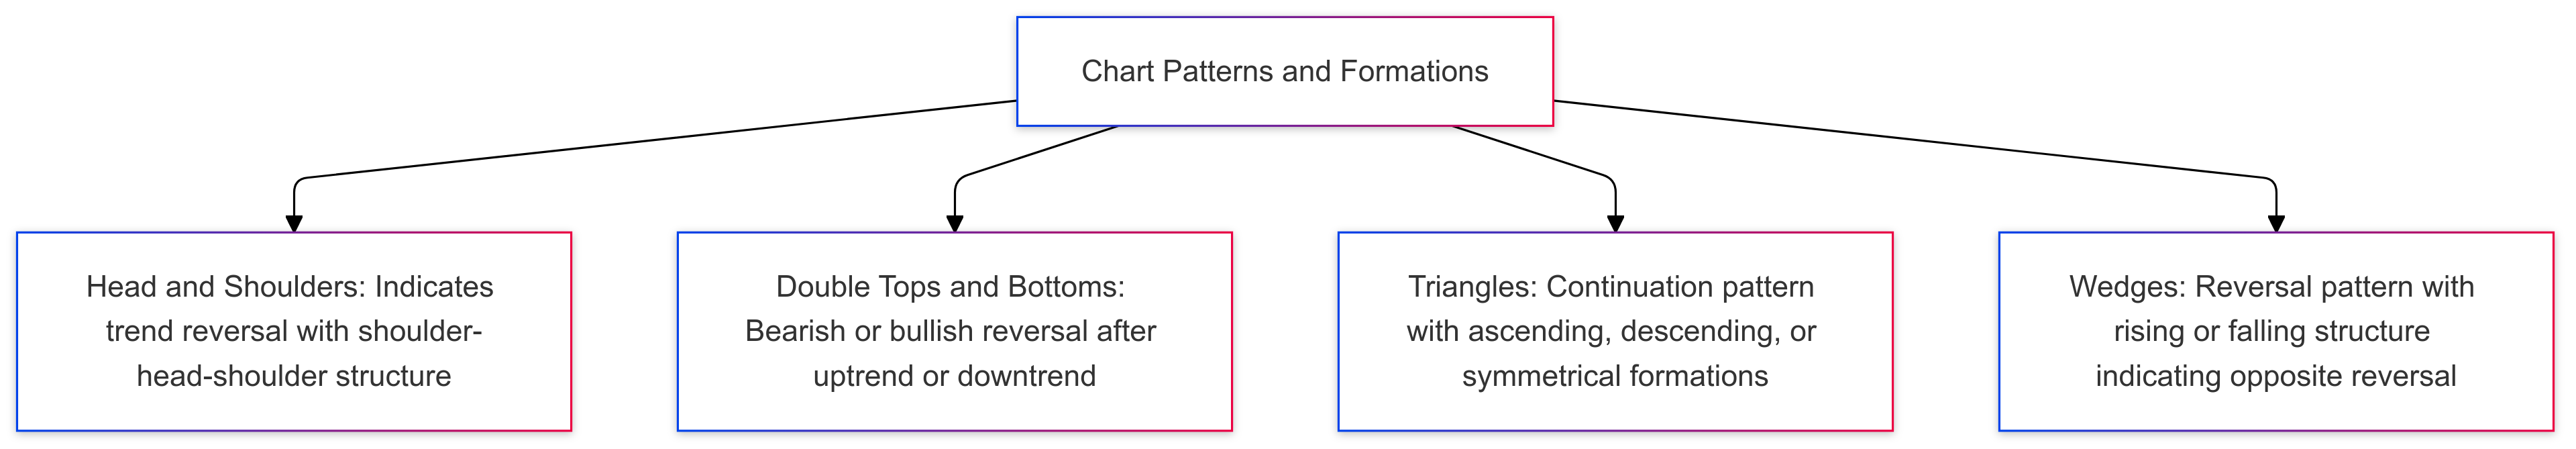
- Head and Shoulders: A reversal pattern that indicates a potential change in trend direction. This pattern consists of a peak (shoulder), followed by a higher peak (head), and then another lower peak (shoulder).
- Double Tops and Bottoms: A reversal pattern that indicates a potential change in trend direction. Double tops form after an uptrend and signal a bearish reversal, while double bottoms form after a downtrend and signal a bullish reversal.
- Triangles: A continuation pattern that suggests the price will continue in the same direction. Triangles can be ascending, descending, or symmetrical, each indicating different market conditions.
- Wedges: A reversal pattern that indicates a potential change in trend direction. Wedges can be rising or falling, signaling a potential reversal in the opposite direction of the wedge’s slope.
Understanding these chart patterns can help traders anticipate future price movements and make more strategic trading decisions.
Market Sentiment Analysis
Market sentiment analysis involves analyzing market data to determine the overall attitude of traders and investors towards a particular cryptocurrency. This can be done by examining various factors:
- Price Movements: A rising price can indicate bullish sentiment, while a falling price can indicate bearish sentiment.
- Trading Volume: High trading volume can indicate strong interest in a cryptocurrency, while low trading volume can indicate a lack of interest.
- Social Media and Online Forums: Analyzing online discussions and sentiment can provide insights into market sentiment. Platforms like Twitter, Reddit, and specialized crypto forums are valuable sources of sentiment data.
- Technical Indicators: Certain technical indicators, such as the RSI, can provide insights into market sentiment by indicating overbought or oversold conditions.
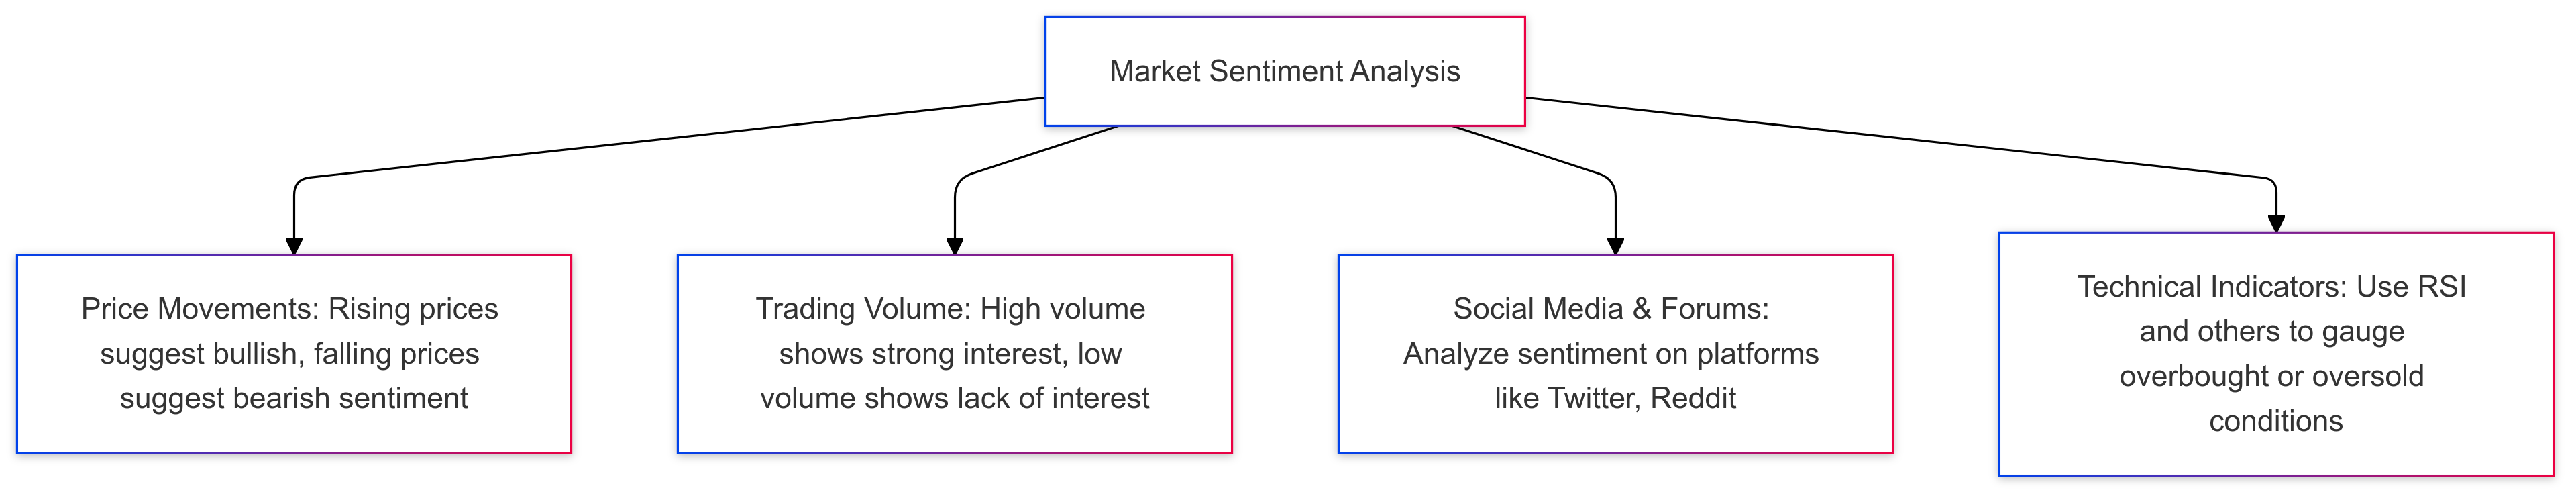
By combining technical analysis, fundamental analysis, and on-chain analysis, traders can gain a more comprehensive understanding of the crypto market and make more informed trading decisions. Understanding market sentiment is crucial for anticipating market movements and adjusting trading strategies accordingly.
What Are Crypto Pricing Forecasts and Market Sentiment?
At some point, every trader gets confused. Should I buy? Sell? Am I bullish or bearish? If these questions sound familiar, then a trip to the FX Leaders Crypto Forecasts portal is must.
Crypto Forecasts is dedicated solely to the study and projection of the cryptocurrency asset class. Our team of market analysts take a deep dive on a variety of cryptos, from industry standards like Bitcoin (BTC) and Ethereum (ETH) to more obscure offerings such as Tron (TRX).
Crypto Forecasts is periodically updated to reflect important trends and key developments in price action. Technical analysis tools play a crucial role in making accurate crypto pricing forecasts.
If you’re uncertain about the path forward for cryptos, or want to compare notes with a market veteran, then this page is right in your wheelhouse.
Each Crypto Forecast entry addresses the following key issues:
- Background: Important historical background, market standing, and recent information facing the featured coin are broken down in detail.
- Pricing Data: As we mentioned earlier, pricing data is the key to technical analysis. All crypto forecasts include recent changes in asset price, going back to 2018.
- 5-Year Price Prediction: Accurately predicting an asset’s price over five years is no easy task. Nonetheless, the FX Leaders team takes it head-on, analyzing the key fundamentals likely to influence crypto values over the long haul.
- Technical Analysis: No crypto forecast would be complete without some technical analysis. All forecasts include an in-depth look at key technical levels and areas of support and resistance.
If you’ve hit a roadblock in your cryptocurrency trading then a visit to Crypto Forecasts may be just what you need to get back on the winning track.
Crypto Technical Analysis: Pros & Cons
| Pros | Cons |
| Provides concrete crypto market entry and exit points | Can produce conflicting signals leading to “analysis paralysis” |
| Is extremely useful in identifying important trends and reversals | Doesn’t always function well during hyper-active news cycles |
| May be readily combined with fundamental or volume analysis | Often provides too much information, overwhelming the crypto trader |
Get Started
In crypto, there’s no time like the present! 2021 has been an epic year for cryptocurrencies and many think that the trading will get even better. If you’re interested in pursuing your financial goals in the cryptosphere, technical analysis is a great way to get started. Check out our Live Rates, Charts, and Forecasts portals and get to work!

FAQs: Crypto Strategy: Cryptocurrency Technical Analysis
- What is cryptocurrency technical analysis?Technical analysis in crypto involves studying past price movements and trends to predict future market behavior. This analysis uses tools like charts, patterns, and indicators to identify trading opportunities and gauge market sentiment.
- Why is technical analysis important for crypto traders?
- Technical analysis helps traders make better-informed decisions by identifying trends, support, and resistance levels, and potential reversal points. It’s especially valuable in crypto markets, where price movements can be highly volatile.
- What are the best indicators for cryptocurrency trading?
- Popular indicators include the Relative Strength Index (RSI) for identifying overbought or oversold conditions, Moving Average Convergence Divergence (MACD) for trends, and Bollinger Bands for assessing volatility and potential breakouts.
- How do live rates and charts assist in crypto trading?
- Live rates provide real-time price updates, while charts visually display historical price action. Together, they allow traders to track current trends, make quick decisions, and identify potential trading opportunities.
- What are some common chart patterns in crypto trading?
- Common patterns include Head and Shoulders for trend reversals, Double Tops and Bottoms signaling potential market changes, and Triangles indicating potential continuation in the current trend direction.
- Can technical analysis be used alongside other strategies in crypto?
- Yes, technical analysis is often combined with fundamental analysis and market sentiment insights. This multi-layered approach provides a more comprehensive view of the market, helping traders make well-rounded decisions.
- What role does market sentiment play in technical analysis?
- Market sentiment reflects the overall attitude of traders and investors. By analyzing sentiment indicators, trading volume, and price trends, traders can gauge whether the market is bullish or bearish, which helps inform their technical analysis.
- Are live rates and charts available for all cryptocurrencies?
- Most platforms provide live rates and charts for major cryptocurrencies like Bitcoin, Ethereum, and popular altcoins. However, coverage of less prominent cryptos may vary depending on the platform.
Sidebar rates
