Crypto Strategy: Parabolic SAR
Last Update: October 27th, 2024
What is Parabolic SAR in Crypto Trading?
The Parabolic SAR (Stop and Reverse) is a powerful technical indicator used in crypto trading to identify potential trend reversals and provide clear entry and exit points.
Developed by J. Welles Wilder, the Parabolic SAR indicator is a momentum-based tool that helps traders navigate the often volatile cryptocurrency market.
It is particularly effective in trending markets, where it can accurately signal the direction of price movement. However, its performance can deteriorate in sideways or consolidating markets, leading to false signals.
The Parabolic SAR indicator is visually represented as a series of dots placed either below or above the price chart. When the dots are below the price, it indicates an uptrend, suggesting a buying opportunity.
Conversely, when the dots are above the price, it signals a downtrend, indicating a potential sell. This intuitive visual representation makes the Parabolic SAR an accessible and valuable tool for traders looking to identify potential trend reversals and optimize their entry and exit points.
How Does The Parabolic SAR Indicator Work?
One of the key attributes of the parabolic SAR is that it is an intuitive, user-friendly trading tool.
As in the name “stop and reversal,” the indicator aims to signal traders when a prevailing trend is nearing exhaustion and ready to change course, helping to determine trend direction. This is accomplished by comparing periodic extremes and integrating a multiplier.
From a practical standpoint, the PSAR calculation is involved and makes two foundational assumptions:
- EP: The EP, or “extreme point,” is a bullish or bearish trend’s periodic high or low.
- AF: The AF, or “acceleration factor,” is a multiplier used to offset the value for graphic representation. Typically, the AF is set at 0.02.
Given the EP and AF, the PSAR is calculated as follows:
- Uptrend: PSAR = Prior PSAR + (Prior AF(Prior EP – Prior PSAR))
- Downtrend: PSAR = Prior PSAR + (Prior AF(Prior PSAR – Prior EP))
Confused? Don’t be ― the PSAR is a public domain indicator that is calculated and graphed automatically by most software trading platforms.
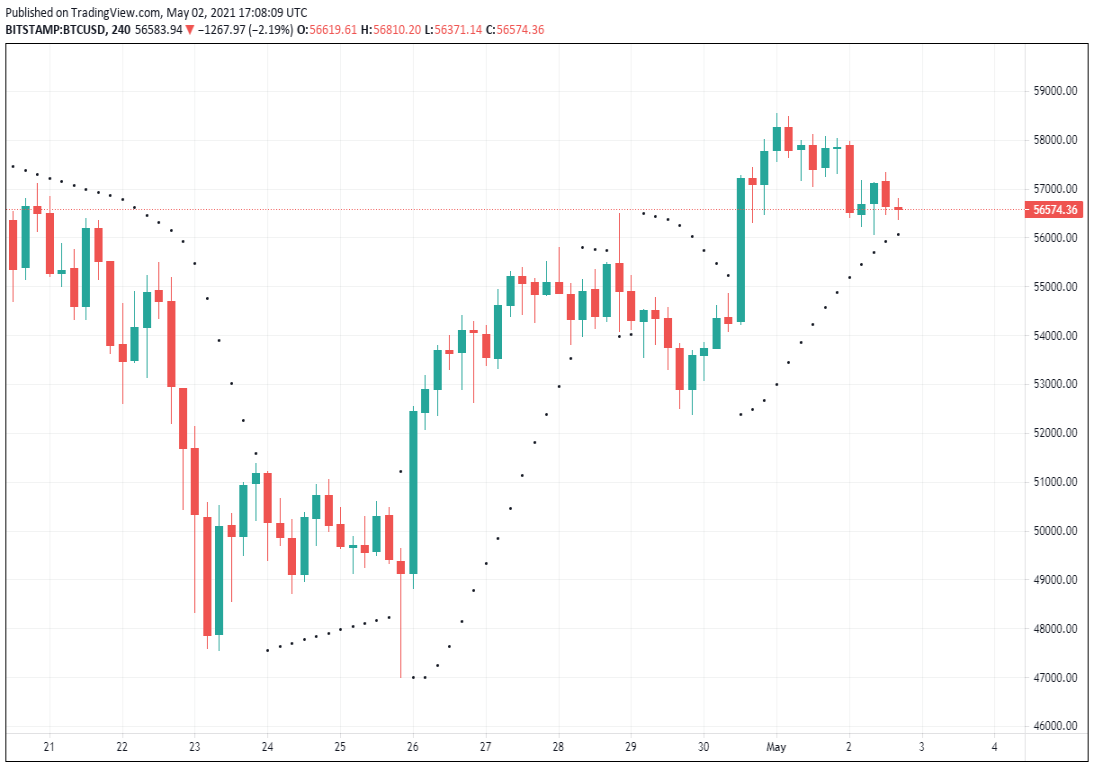
It is represented by a dot below (uptrend) or above (downtrend) select pricing bars. As an example, the chart below is how the PSAR looks on a four-hour Bitcoin chart.
Calculating the SAR Indicator
The Parabolic SAR indicator is calculated using a specific formula that incorporates key parameters to track the trend. The formula is as follows:
SARn = SARn-1 + AF × (EPn-1 – SARn-1)
Where:
- SARn: the current Parabolic SAR value
- SARn-1: the previous Parabolic SAR value
- AF: the acceleration factor
- EPn-1: the previous extreme point (the highest high or the lowest low)
The acceleration factor (AF) is a crucial parameter that controls the movement of the SAR dots. It starts at a default value, typically 0.02, and increases as the trend strengthens, causing the SAR dots to move closer to the price at an accelerating pace. This helps the indicator adapt to the trend’s momentum.
The maximum acceleration (MA) parameter limits the growth of the AF, preventing it from becoming too sensitive and generating false signals.
How Is The Parabolic SAR Used In Crypto?
As you can see from the chart above, using parabolic SAR in crypto trading is simple. In an uptrend, the dots are below price and moving upward; in a downtrend, the opposite is true.
Given its intuitive presentation, the PSAR is ideal for trend and reversal trading. The PSAR signals that one of three actions is possible at any given time:
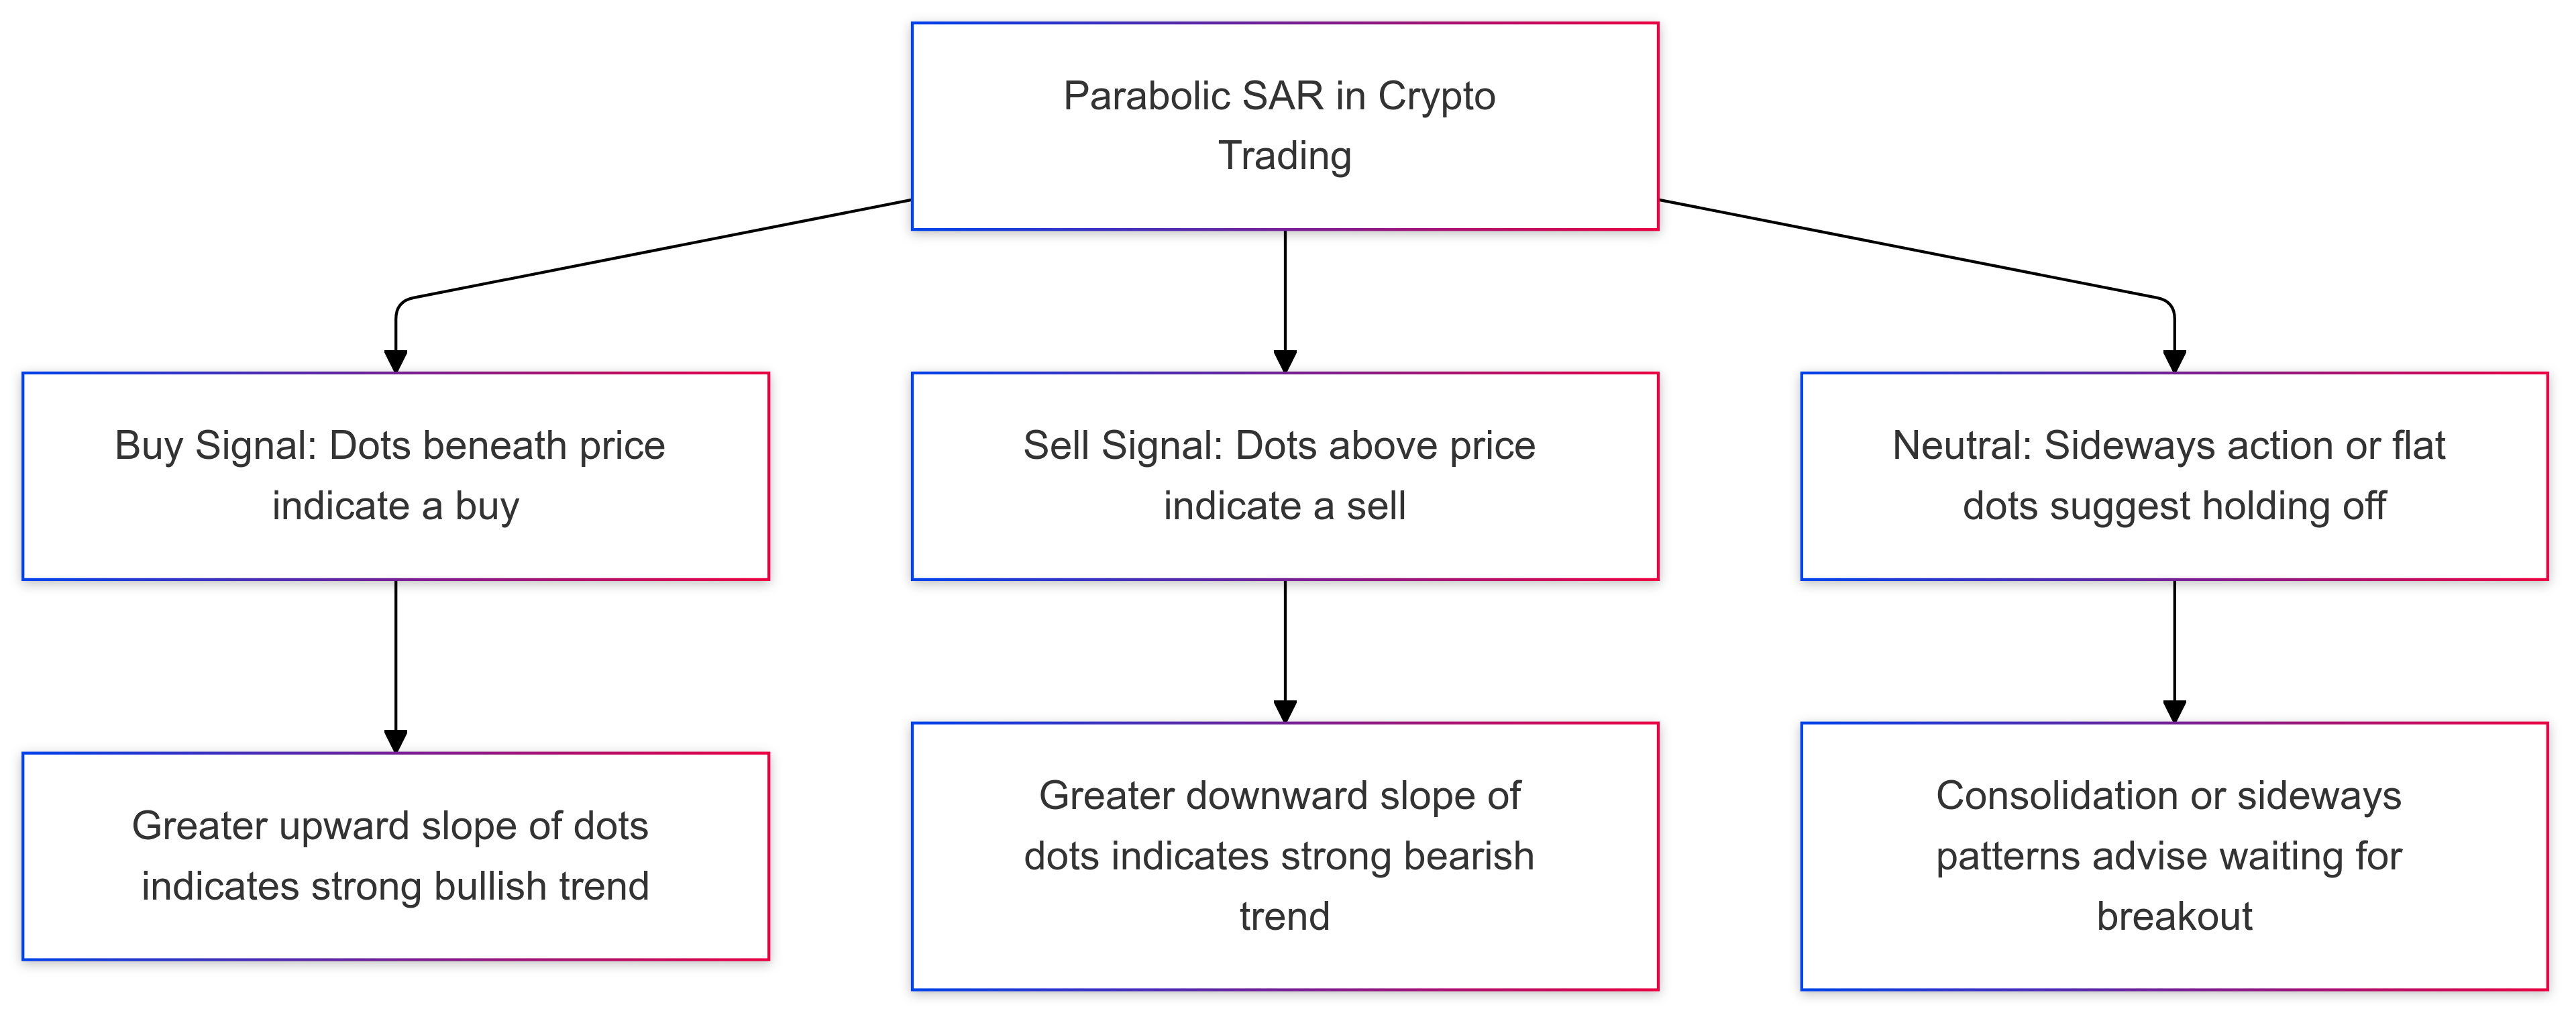
- Buy: If the dots are beneath price, a buy is suggested. Also, the greater the upward slope of the dots, the stronger the bullish trend.
- Sell: If the dots are above price, a sell is suggested. In addition, the greater the downward slope of the dots, the stronger the bearish trend.
- Neutral: During consolidation patterns or sideways action, the PSAR will still print dots above or below price action. However, they will have a flat trajectory and are less reliable. When in rotational cryptocurrency market conditions, it is best to wait until the market breaks out and chooses a direction before entering a trade.
The key element of trading cryptocurrencies with the PSAR is recognizing when the dots cross over price. When this happens, it is considered to be a sign of reversal and a potential buy or sell signal.
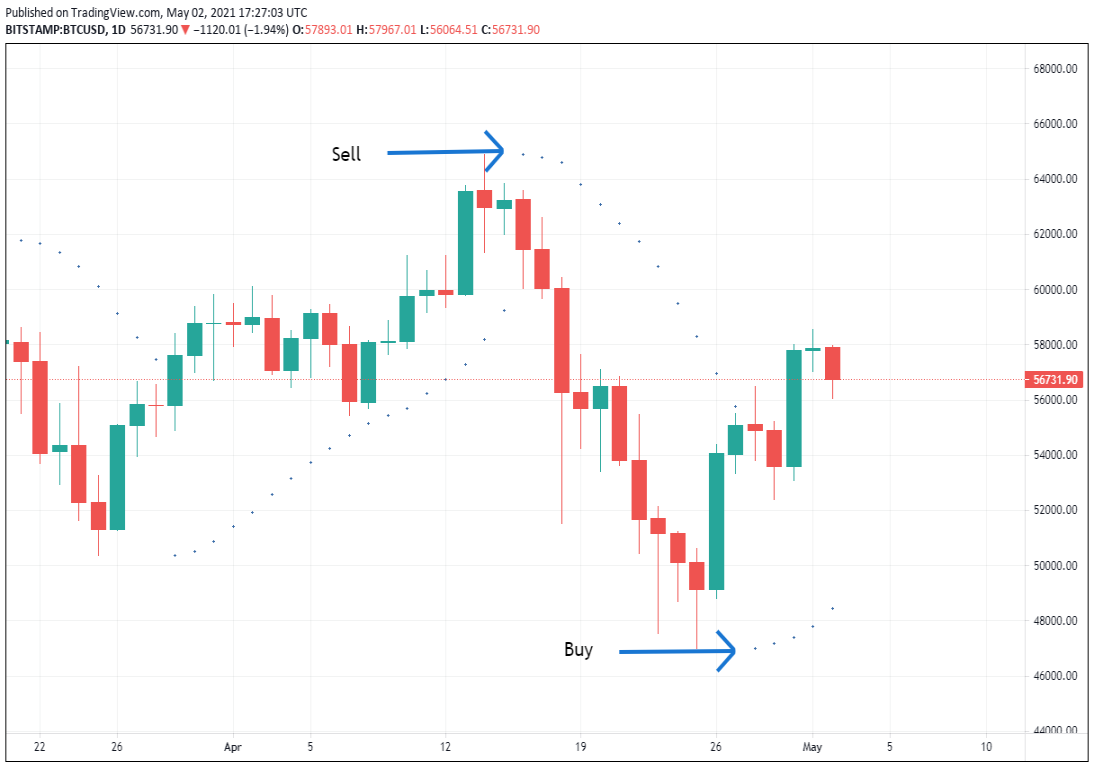
For example, check out the daily Bitcoin chart below.
As you can see, a formidable daily downtrend begins at April’s spike high near $65,000. At this point, the dots jumped above price, signalling that it was time to sell. The opposite scenario was true when BTC posted its April low near $46,000.
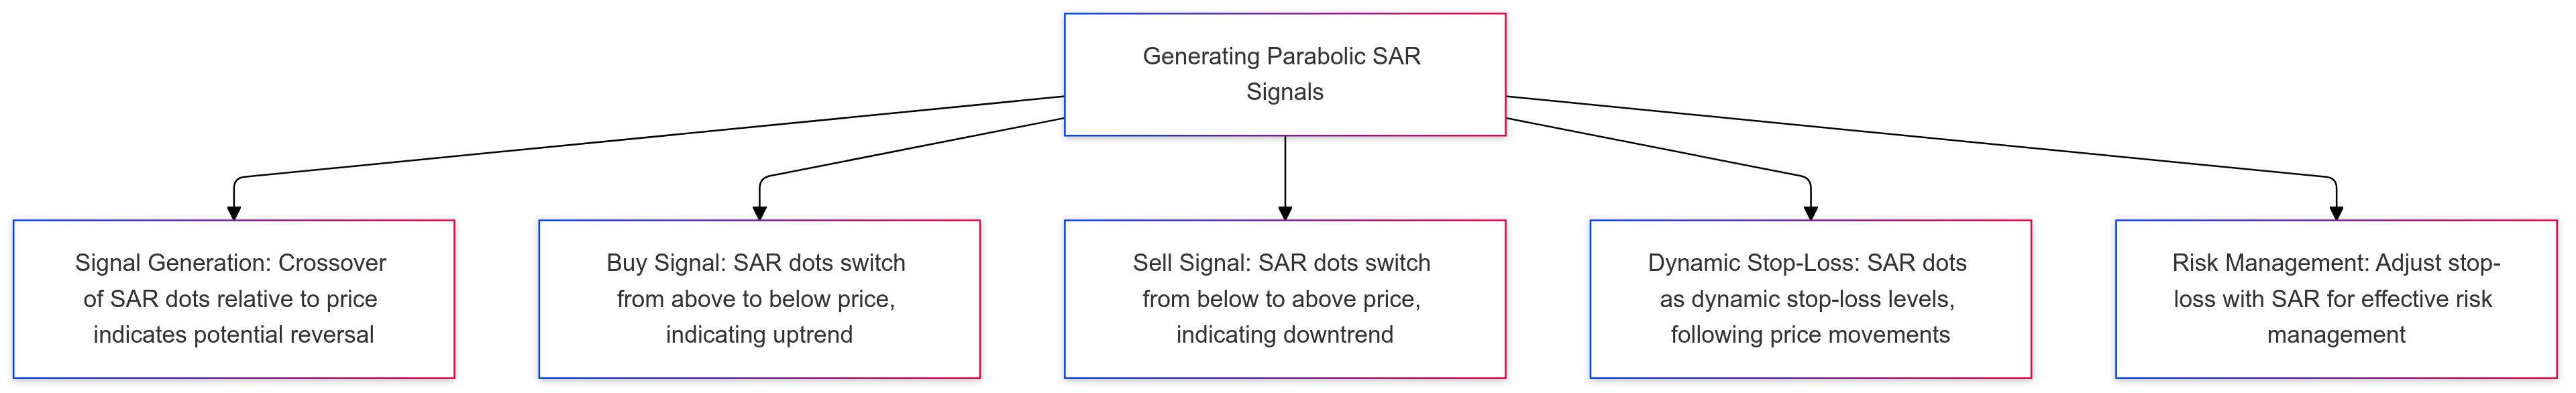
Generating Parabolic SAR Signals
i. Signal Generation: The Parabolic SAR generates signals based on the crossover of SAR dots relative to price. When SAR dots switch from above to below the price (or vice versa), it indicates a potential trend reversal.
ii. Buy Signal: If SAR dots move from above the price to below, it signals a potential buy as the market may be entering an uptrend.
iii. Sell Signal:If SAR dots move from below the price to above, it signals a potential sell, suggesting a possible downtrend.

iv. Dynamic Stop-Loss Levels: The SAR dots can serve as dynamic stop-loss levels by moving closer to the price as trends strengthen.
This allows traders to lock in profits while limiting losses as SAR dots follow price movements.
v. Risk Management: By adjusting stop-loss levels according to SAR dot positions, traders can protect gains and manage risk effectively, especially during strong trends.
Things To Watch Out For When Trading Crypto With The Parabolic SAR
Like using the parabolic SAR in forex trading, there are a few things to watch out for in crypto. Here’s a brief look at three of the most important:
False Signals:
- The Parabolic SAR (PSAR) can generate misleading signals, especially during periods of market consolidation or sideways movement.
- In choppy markets, PSAR dots frequently cross over price, leading to unreliable buy and sell signals.
- Reducing False Signals: Wait for multiple dots to confirm a trend or combine PSAR with another technical tool to strengthen reversal signals.
Market Fundamentals:
- PSAR is trend-based, so ignoring market fundamentals can lead to unexpected outcomes during live trades.
- Sudden news, regulatory changes, or security issues can disrupt PSAR’s accuracy due to rapid price swings.
- Best Practice: Monitor evolving fundamentals to align PSAR signals with broader market events, reducing the likelihood of losses from sudden volatility.
Risk vs. Reward:
- PSAR is suited for capturing larger profit targets typical of trend-based strategies, often aiming for a risk-to-reward ratio of 1:3 or higher.
- Managing Risk in Real-Time: Use PSAR as an exit signal to lock in gains dynamically, which helps maintain a balanced approach to risk and reward during active trends.
By following these practices, traders can use PSAR more effectively, minimizing false signals, aligning with market fundamentals, and managing risk for more consistent results.
Predicting Prices And Trend Direction With The Parabolic SAR
Crypto price prediction is always a delicate endeavor, specifically during periods of high volatility. When using the PSAR to attempt this task, it’s a good idea to view the market in broad terms. Remember, it is a lagging, trend-oriented indicator; this means that the data (dots) is reflective of what has happened, not what will happen.
Specific price points are hard to come by, but the dot crossovers are key. When the PSAR crosses over current price, it is safe to say that the market is under reversal.
If this is the case, then short-term price action is likely to follow suit. Of course, accurately estimating how long price will move directionally depends upon a myriad of other technical and fundamental factors.
Combining Parabolic SAR with Other Indicators
Enhance Parabolic SAR’s effectiveness by pairing it with additional indicators:
- Moving Averages: A Parabolic SAR buy signal combined with a golden cross confirms a strong uptrend, increasing confidence in long positions.
- RSI: Use Parabolic SAR with RSI to spot overbought/oversold conditions, validating potential trend reversals.
- Stochastic Oscillator: Combining with the stochastic oscillator highlights momentum shifts, helping avoid weak trends.
This multi-indicator approach filters out false signals, improves trend accuracy, and supports informed trading decisions.
Pros And Cons Of The Parabolic SAR
| Pros | Cons |
| Provides easy-to-use visual cues on when to buy or sell crypto | The PSAR is a lagging indicator, so it’s one step behind evolving crypto price action |
| May be applied to any cryptocurrency on any timeframe | Does not address crypto trend strength |
| Compliments other indicators such as the RSI and Stochastics | In consolidating crypto markets, the PSAR often produces an abundance of false signals |
Common Mistakes To Avoid When Using The Parabolic SAR Indicator
No matter how strong a crypto indicator or trading signal is, it’s still possible to make mistakes. Here are are several of the most common made when trading the PSAR:
- Overleveraging: No indicator is infallible! Be sure to practice sound risk management and avoid using too much leverage.
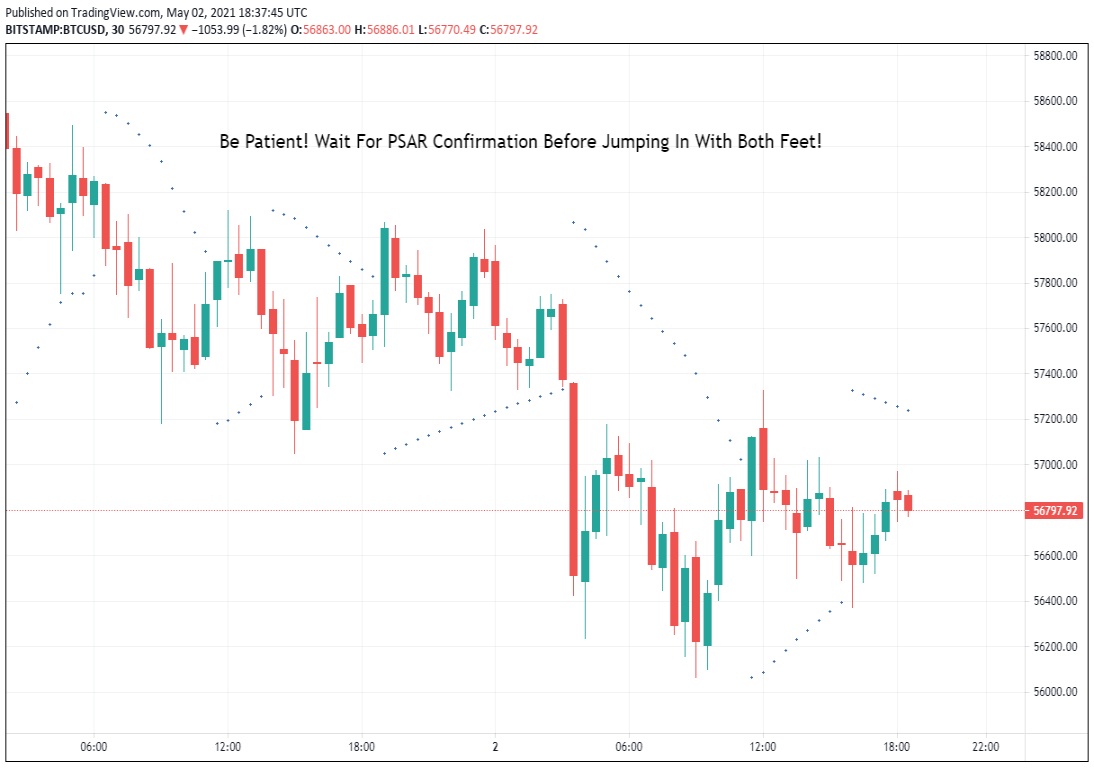
- Premature Market Entry: In many cases, traders are anxious to enter the market and do not wait for PSAR confirmation. To be successful using this indicator, it’s a good idea to wait for more than one dot before entering a new trend.
Apply To Sideways Markets: The PSAR is not a rotational or breakout indicator. If you’re going to use it to trade cryptos, wait for periods of enhanced volatility or clear-cut trends.
Get Started
The parabolic SAR is a great trend and reversal trading tool. It’s easy to read, understand, and produces clear-cut signals. When applied within the context of a comprehensive cryptocurrency market plan, the PSAR can be an invaluable tool for active traders.
If you’re interested in trading cryptos using technical analysis, the PSAR is a fantastic place to start.
FAQs: Crypto Strategy – Parabolic SAR
- What is the Parabolic SAR in crypto trading?
The Parabolic SAR (Stop and Reverse) is a trend-following indicator that helps traders identify the direction of price movement and potential reversal points. Created by Welles Wilder Jr., it’s widely used in crypto trading to spot buy and sell signals.
- How does the Parabolic SAR indicate buy and sell signals?
When the Parabolic SAR dots are below the price, it signals an uptrend, suggesting a buying opportunity. When the dots are above the price, it indicates a downtrend, signaling a possible sell. Crossovers between price and SAR dots often suggest a trend reversal.
- Can the Parabolic SAR be used in all market conditions?
The Parabolic SAR is most effective in trending markets. In sideways or consolidating markets, it can produce false signals due to frequent crossovers, so traders often avoid using it in such conditions.
- How is the Parabolic SAR calculated?
The Parabolic SAR calculation involves two key factors: the Extreme Point (EP) of the trend (high or low) and the Acceleration Factor (AF). The formula adjusts with each new price movement to track the trend. Fortunately, most trading platforms calculate and plot the SAR automatically.
- What are the advantages of using the Parabolic SAR in crypto trading?
The Parabolic SAR provides easy-to-read visual cues for trend reversals, making it user-friendly. It’s also highly versatile, applicable to any cryptocurrency and timeframe, and works well in combination with other indicators like RSI or moving averages.
- What are some limitations of the Parabolic SAR?
As a lagging indicator, the Parabolic SAR can sometimes signal a trend change late, especially during rapid price shifts. It’s also less reliable in choppy or consolidating markets, where it may produce numerous false signals.
- What mistakes should traders avoid when using the Parabolic SAR?
Common mistakes include over-leveraging, entering trades prematurely without multiple confirmations, and using the Parabolic SAR in sideways markets where it tends to be less accurate. Waiting for multiple dots to confirm a trend is often recommended.
- How can the Parabolic SAR be combined with other indicators?
Traders often pair the Parabolic SAR with indicators like the RSI for added confirmation of overbought or oversold conditions, or with moving averages to verify trend direction. This helps filter out false signals and provides a clearer trading strategy.
- How does the Parabolic SAR fit into a risk management strategy?
The Parabolic SAR can help set stop-loss levels as it tracks trend direction. By adjusting stops with each SAR dot, traders can secure profits and manage risk effectively, especially during strong trends.
- Is the Parabolic SAR useful for predicting future crypto prices?
While not predictive, the Parabolic SAR provides valuable trend and reversal signals, helping traders gauge likely price direction. For price predictions, traders typically combine the Parabolic SAR with other technical and fundamental analyses.
Sidebar rates
