Crypto Guide: A Complete Guide to Day Trading Bitcoin
Last Update: December 8th, 2024
Bitcoin day trading involves opening and closing trades and trading cryptocurrency within the same day, capitalizing on the cryptocurrency’s high volatility and liquidity. This fast-paced trading style is particularly appealing due to Bitcoin’s frequent and often dramatic price fluctuations, which create opportunities for significant short-term gains.
However, Bitcoin day trading is not without risks. Sudden market downturns or regulatory changes to crypto trading can lead to steep losses, highlighting the importance of risk management and preparation.
Benefits and Challenges of Bitcoin Day Trading
Day trading Bitcoin offers several advantages: access to 24/7 markets, potential profitability, and user-friendly digital currency exchanges. Yet, the challenges are significant. Extreme volatility requires a strong grasp of technical analysis, emotional discipline, and a willingness to adapt to rapid price changes. Beginners often find these demands daunting.
Success in Bitcoin day trading depends on expertise in risk management, chart interpretation, and the use of trading tools such as stop-loss orders and technical indicators. Additionally, traders need to maintain a disciplined mindset and continuously refine their strategies in response to the dynamic, cryptocurrency trading ecosystem.
Understanding the Cryptocurrency Market
Cryptocurrency markets operate without centralized control, relying instead on decentralized networks of computers. Bitcoin, for example, can be traded on exchanges and stored in digital wallets. Its price is influenced by supply, market demand, regulatory developments, and media coverage. Some analysts suggest that production costs influence Bitcoin’s price, but this remains a topic of debate.
Unlike traditional currencies, Bitcoin is not issued by central banks or tied to government policies. Conventional economic indicators like inflation rates or GDP growth have limited impact on its value. This detachment trade cryptocurrency from traditional financial systems has drawn individual investors seeking a hedge against global economic instability.
Investors vs. Traders
- Investors: Retail investors often view Bitcoin as a long-term asset, holding it in anticipation of future value appreciation.
- Traders: Conversely, retail traders focus on short-term profits, executing daily, weekly, or monthly trades. Unlike investors, traders rarely hold Bitcoin for extended periods.
Institutional adoption of Bitcoin, once hampered by market volatility and technical barriers, has grown rapidly. Notable developments, such as Bitcoin ETFs from major institutions like BlackRock, signify increasing mainstream acceptance.
Setting Up for Day Trading Success
- Choosing the Right Trading Platform
Selecting a reliable trading platform is a crucial first step. Platforms like Binance, Coinbase Pro, and Kraken offer high liquidity, competitive trading fees for, and robust security. Consider the platform’s reputation, ease of use, fee structure, and availability of advanced tools such as real-time charting and stop-loss features. While decentralized exchanges (DEXs) like Uniswap provide privacy, centralized exchanges often offer the liquidity needed for day trading.
- Opening a Trading Account
Most centralized exchanges require completing a Know Your Customer (KYC) verification process, involving identity and address verification. Use strong passwords and enable two-factor authentication (2FA) for added security. For long-term holdings, consider cold storage wallets like Ledger or Trezor to protect your digital assets further from potential exchange vulnerabilities.
- Managing Capital and Risk
Before trading, evaluate your capital and risk tolerance. Only trade with funds you can afford to lose, and set aside a dedicated trading budget. Use stop-loss orders to minimize losses, and limit your trade size to 1-2% of your total capital per trade. This disciplined approach helps protect your portfolio from excessive risk.
- The Value of a Trading Journal
Maintaining a trading journal is an essential habit for day traders. Use a spreadsheet to log all transactions, including entry and exit points, trade sizes, and outcomes. This record allows you to analyze your performance objectively, identify patterns, and refine your strategies.
A trading journal also promotes psychological resilience. By planning for losses and tracking progress, traders can maintain confidence and reduce the emotional impact of setbacks. Over time, this practice fosters consistency and discipline, key traits for long-term success in day trading.
The Role of News in Bitcoin Price Fluctuations
The cryptocurrency market is notoriously sensitive to news, with announcements often triggering significant price movements. Key events such as regulatory updates, major partnerships, and security breaches can impact market sentiment, creating opportunities for traders.
Examples of News Impacting Bitcoin Prices
- Negative News: In 2021, when China announced a ban on cryptocurrency transactions, Bitcoin’s price plummeted as panic gripped the market, leading to a widespread sell-off.
- Positive News: In contrast, news of institutional adoption, such as Tesla’s announcement of Bitcoin purchases in 2021, resulted in a sharp price rally, fueling optimism among traders.
Why Traders Monitor News
- Opportunities: Reacting swiftly to news can help traders capitalize on short-term price movements.
- Risk Mitigation: Being informed about potential regulatory changes or security vulnerabilities allows traders to adjust their strategies accordingly.
Key Sources of Market News
- Regulatory announcements (e.g., government policy changes)
- Institutional adoption or investment
- Technological advancements (e.g., blockchain upgrades)
- Social media and influencer trends
Key Day Trading Strategies for Bitcoin
Day trading Bitcoin requires agility, discipline, and a deep understanding of market strategies. Below are five proven approaches, with practical examples to illustrate their application:
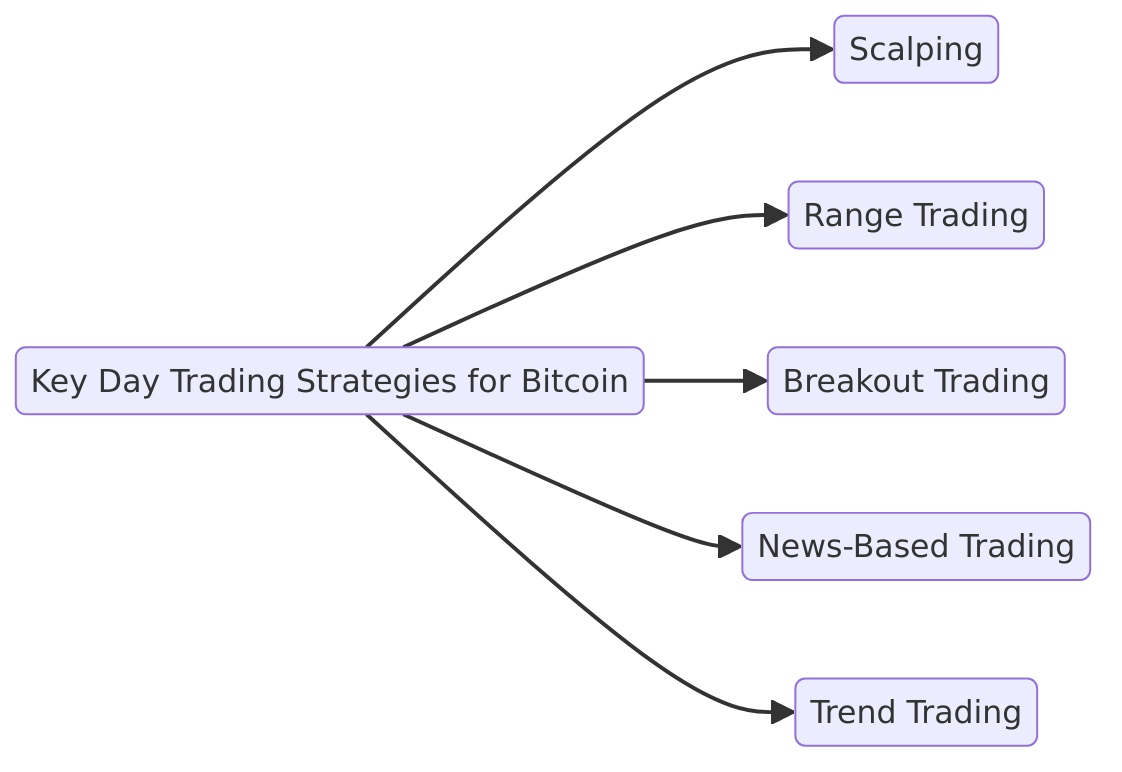
1. Scalping
Scalping focuses on profiting from small price movements by executing multiple trades in a single day. This strategy relies on high trading volume to accumulate small gains that add up over time.
Key Principles:
- Lower Exposure Reduces Risk: Short trade durations minimize the risk of adverse market events.
- Frequent Small Moves: Smaller price movements occur more often, offering more trading opportunities.
- High Volume: Scalpers rely on numerous trades to generate significant returns.
Example:
A scalper might buy Bitcoin at $74,600 and sell at $74,650, profiting from a $50 price movement. Repeating this multiple times throughout the crypto day trading, can result in substantial cumulative profits.
2. Range Trading
Range of trading strategy involves identifying price ranges defined by support (lower boundary) and resistance (upper boundary) levels, and making trades based on these levels.
How It Works:
- Buy near support and sell near resistance for long positions.
- Sell near resistance and buy back near support for short positions.
Key Tools:
- Trendlines to identify support and resistance levels.
- Oscillators like RSI to detect overbought or oversold conditions.
Example:
If Bitcoin trades between $74,000 (support) and $75,000 (resistance), a trader might buy at $74,100 and sell at $74,900, capitalizing on the next swing trading range.
3. Breakout Trading
Breakout trading capitalizes on price movements beyond established support or resistance levels, signaling the start of a new trend.
How It Works:
- Identify key levels of support and resistance.
- Enter a trade when the price breaks through these levels and shows sustained momentum.
Example:
If Bitcoin has been trading in a range of $73,500 to $74,500 and breaks above $74,500 with high volume, a breakout trader might enter a long position, targeting further upside.
Risk Management:
Use stop-loss orders just below the breakout level to limit losses if the breakout fails.
4. News-Based Trading
Trading based on crypto market and news involves reacting quickly to events that influence cryptocurrency prices. This strategy requires staying informed and ready to act at a moment’s notice.
Types of News Affecting Bitcoin:
- Regulatory Updates: Positive regulations can drive prices up, while bans or restrictions can cause declines.
- Institutional Adoption: News of major corporations investing in Bitcoin often leads to price surges.
- Technological Updates: Advances like Taproot activation in Bitcoin can positively influence prices.
Example:
If a major bank announces plans to integrate Bitcoin services, traders might buy Bitcoin immediately, anticipating a price rally.
5. Trend Trading
Trend trading involves identifying and trading in the direction of a market trend, whether upward (bullish) or downward (bearish).
How It Works:
- Uptrend: Buy during pullbacks in an uptrend, defined by higher highs and higher lows.
- Downtrend: Short-sell during rallies in a downtrend, marked by lower highs and lower lows.
Example:
If Bitcoin consistently forms higher highs and higher lows, a trader might buy on a dip at $74,200, expecting the trend to continue upward.
Risk Management: Set take-profit and stop-loss orders to lock in gains and minimize losses if the trend reverses.
Adapting Strategies to Market Conditions
Each strategy performs differently depending on market conditions. Adapting your approach is crucial for success:
- Bull Markets: Use trend-following strategies like breakout trading or buying dips.
- Bear Markets: Opt for short-selling or range trading between support and resistance levels.
- High Volatility: Employ scalping or news-based trading to take advantage of rapid price movements.
- Sideways Markets: Focus on range trading, capitalizing on predictable price boundaries.
Technical Analysis for Bitcoin Day Trading
Technical analysis is a vital tool for Bitcoin day traders, helping to decode market sentiment, identify trends, and refine entry and exit strategies. By analyzing historical price data and patterns, traders can make informed decisions and minimize inefficiencies in the highly volatile cryptocurrency market.
Key Benefits of Technical Analysis
- Identifies bullish and bearish trends to align trades with market momentum.
- Assesses support and resistance levels for optimal trade entries and exits.
- Provides actionable insights through tools like oscillators, trendlines, and volume indicators.
Essential Technical Analysis Tools
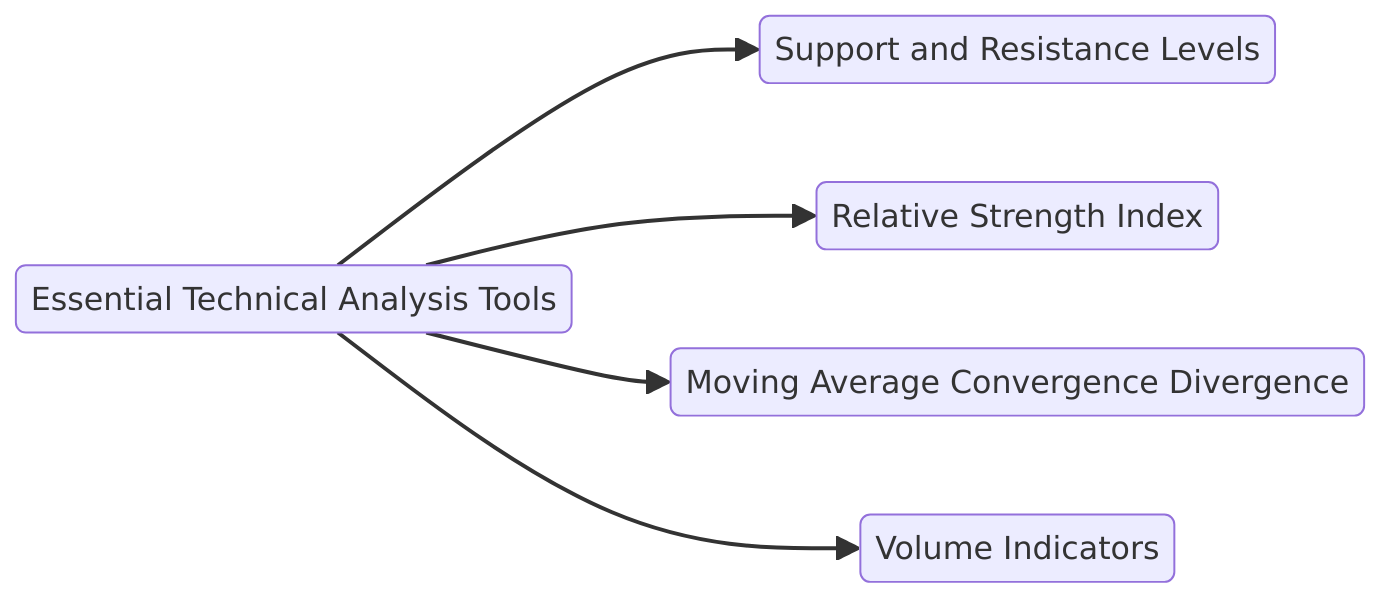
1. Support and Resistance Levels
Support and resistance levels are foundational concepts in technical analysis, marking areas where supply and demand balance influences price movements.
- Support
When demand matches supply, the price stops falling, creating a support level. Repeated tests of this level without a breakdown indicate its strength, giving traders confidence to enter long positions.
Example:
If Bitcoin consistently rebounds near $70,000, this level is considered strong support. However, if the price breaks below $70,000, it may fall further until new support is found. - Resistance
Resistance forms when supply exceeds demand during an upswing, capping price growth. Traders often short Bitcoin near these levels.
Example:
If Bitcoin struggles to break above $75,000, this becomes a resistance level. A breakthrough above $75,000 could signal a continued uptrend.
2. Relative Strength Index (RSI)
The RSI measures the speed and change of price movements on a scale from 0 to 100, helping traders identify overbought or oversold conditions.
- Overbought: RSI > 70 suggests a potential reversal or correction.
- Oversold: RSI < 30 signals a possible buying opportunity.
Example:
If Bitcoin’s RSI hits 85 during a rally, traders may anticipate a pullback. Conversely, an RSI of 25 during a downtrend might indicate an upcoming rebound.
3. Moving Average Convergence Divergence (MACD)
The MACD indicator identifies changes in momentum and potential trend reversals using two lines:
- MACD Line: The difference between the 12-day and 26-day EMAs.
- Signal Line: A 9-day EMA of the MACD line.
How It Works:
- Bullish Signal: When the MACD line crosses above the signal line.
- Bearish Signal: When the MACD line crosses below the signal line.
Example:
If Bitcoin’s MACD crosses above its signal line at $72,000, it may indicate bullish momentum, encouraging traders to enter long positions.
4. Volume Indicators
Volume indicators measure the strength of price movements by analyzing trading volume.
- On-Balance Volume (OBV): Tracks cumulative volume to confirm trends.
- Accumulation/Distribution Line: Identifies buying or selling pressure.
- Money Flow Index (MFI): Combines price and volume to identify overbought or oversold conditions.
Example:
If Bitcoin’s price rises to $74,000 with increasing volume, it suggests a strong uptrend. Conversely, a price rise with declining volume may indicate a weakening trend.
Using Chart Patterns to Predict Price Movements
Chart patterns provide visual representations of market psychology, helping traders anticipate trend continuations or reversals.
Common Chart Patterns:
- Head and Shoulders:
- Bearish Signal: Indicates a reversal from an uptrend to a downtrend once the neckline is broken.
Example:
If Bitcoin forms a head-and-shoulders pattern at $75,000, breaking below the neckline at $72,000 may signal a further decline.
- Bearish Signal: Indicates a reversal from an uptrend to a downtrend once the neckline is broken.
- Double Tops and Double Bottoms:
- Double Top: Signals bearish reversal after two failed attempts to break above a price level.
- Double Bottom: Suggests bullish reversal when the price fails to break lower twice and rebounds.
Example:
Bitcoin forming a double top at $74,500 and failing to break higher twice may signal a downturn.
- Triangles (Ascending, Descending, Symmetrical):
- Ascending Triangle: Indicates a bullish breakout is likely.
- Descending Triangle: Suggests a bearish breakout.
- Symmetrical Triangle: Signals indecision but often resolves in the direction of the prevailing trend.
Example:
If Bitcoin forms an ascending triangle with resistance at $75,000, a breakout above this level could indicate further upside.
- Flags and Pennants:
- Continuation Patterns: Indicate that the current trend will likely continue after a brief consolidation.
Example:
A bullish flag during an uptrend signals a likely continuation of the upward movement.
- Continuation Patterns: Indicate that the current trend will likely continue after a brief consolidation.
Combining Indicators for Better Accuracy
Relying on a single indicator can lead to false signals. Combining multiple tools ensures better decision-making:
- Example of Combination:
If Bitcoin’s RSI indicates overbought conditions (RSI > 70) and the MACD crosses below the signal line, traders may anticipate a price drop.
Fundamental Analysis in Day Trading
Fundamental analysis helps day traders evaluate an asset’s intrinsic value by considering factors beyond price movements. For Bitcoin and other cryptocurrencies, this involves assessing broader economic and market trends, financial conditions, and specific factors that influence a coin’s value.
The Role of News and Events in Bitcoin Trading
Market news and events are critical drivers of Bitcoin’s short-term price volatility. Positive developments often lead to price surges, while negative events can trigger sharp declines.
- Positive Examples:
- Institutional adoption (e.g., Tesla purchasing Bitcoin) often boosts investor confidence, leading to price increases.
- Technological advancements, such as blockchain upgrades, enhance Bitcoin’s utility, attracting more buyers.
- Negative Examples:
- Government crackdowns, such as China banning cryptocurrency transactions, often lead to panic selling.
- Security breaches on major exchanges can erode trust and drive prices lower.
Evaluating Market Sentiment and Its Impact on Prices
Market sentiment reflects the collective attitude of traders and investors toward an asset or market. This psychological factor heavily influences market price and cycles.
Types of Sentiment
- Bullish Sentiment: Characterized by optimism and sustained price increases.
- Bearish Sentiment: Defined by pessimism and persistent price declines.
Key Tool: Bitcoin Crypto Fear & Greed Index
This popular index measures Bitcoin market sentiment on a scale of 0 to 100 using factors such as:
- Volatility
- Market Volume
- Social Media Trends
- Dominance
- Search Trends
Example:
A low index score signals fear in the market, potentially indicating a buying opportunity, while a high score suggests greed and potential for a market correction.
Incorporating Macro Trends into Analysis
Macroeconomic trends significantly impact Bitcoin’s value, providing crucial insights for day traders trading crypto here.
Key Macroeconomic Influences
- Inflation: Bitcoin is often viewed as a hedge against inflation, driving demand during periods of economic uncertainty.
- Interest Rates: Higher rates may discourage speculative investments in cryptocurrencies as investors shift to safer, predictable returns.
- Geopolitical Tensions: Events like wars or sanctions can increase Bitcoin demand as a decentralized, borderless asset.
Example:
During a financial crisis, Bitcoin prices may rise as investors seek alternatives to traditional assets like stocks and bonds.
Combining Fundamental and Technical Analysis
For day traders, blending fundamental insights with technical tools enhances decision-making.
- Fundamental Analysis: Focuses on long-term trends and macroeconomic conditions.
- Technical Analysis: Uses charts, patterns, and indicators to forecast short-term price movements.
Example:
A trader might identify bullish sentiment using fundamental analysis and confirm entry points with technical indicators like RSI or MACD.
Risk Management Techniques for Day Trading
Managing risk is crucial for navigating cryptocurrency’s inherent volatility. Effective risk management strategies protect traders from significant losses while maximizing opportunities.
1. Setting Stop-Loss and Take-Profit Levels
Stop-loss and take-profit orders are essential tools for controlling risk and securing profits.
- Stop-Loss Order:
Protects against excessive losses by automatically selling an asset when its price drops to a predetermined level.
Example: A trader sets a stop-loss at $69,000 for Bitcoin, limiting potential losses if the price falls below this level. - Take-Profit Order:
Locks in gains by selling an asset when it reaches a target price.
Example: A trader sets a take-profit at $75,000 to secure profits from a price rally.
2. Allocating a Fixed Percentage of Capital
Limiting exposure to any single trade helps reduce the impact of potential losses.
- One-Percent Rule:
Allocate no more than 1% of trading capital to a single trade.
Example: With a $10,000 account, a trader limits each position to $100. - Volatility-Based Sizing:
Adjust position sizes based on an asset’s volatility, assigning smaller allocations to high-risk trades.
3. Avoiding Emotional Trading
Emotions like greed and fear can lead to impulsive decisions and significant losses. Strategies to prevent emotional trading include:
- Developing a detailed trading plan with predefined entry and exit points.
- Setting realistic goals and adhering to stop-loss levels.
- Avoiding over-leveraging to minimize financial stress.
Example:
A trader avoids panic-selling during a market dip by following a pre-planned strategy based on technical analysis.
Tools and Technology for Day Trading
1. Trading Platforms
Reliable platforms like Binance, Kraken, or Coinbase Pro provide:
- Real-time data and charting tools.
- Custom alerts for price movements.
- Fast execution to capitalize on short-term opportunities.
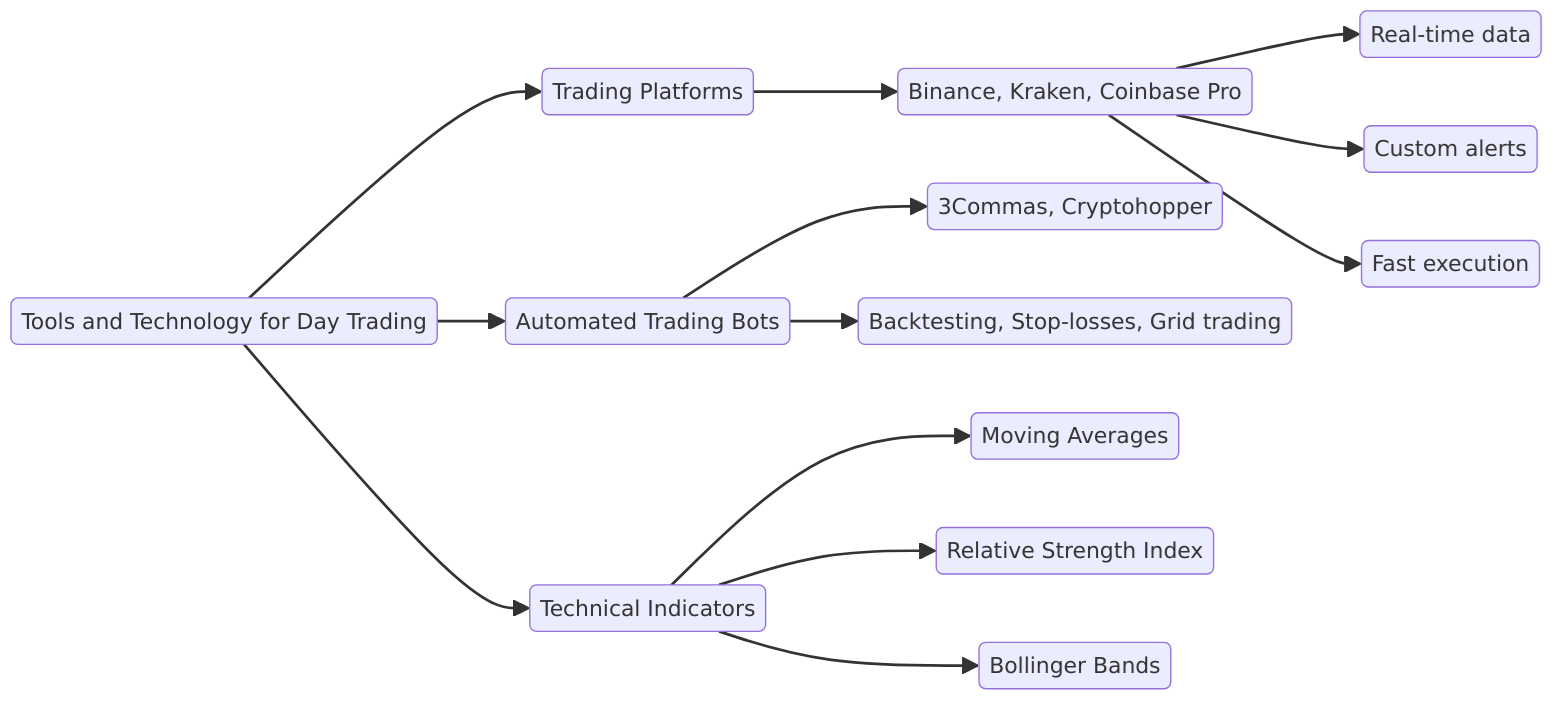
2. Automated Trading Bots
Trading bots execute pre-programmed crypto trading strategies well, reducing emotional bias and improving efficiency.
- Example Bots: 3Commas, Cryptohopper.
- Features: Backtesting, trailing stop-losses, and grid trading.
3. Technical Indicators
Key indicators help traders identify trends and optimal entry/exit points:
- Moving Averages (MA): Identifies trend directions.
- Relative Strength Index (RSI): Detects overbought or oversold conditions.
- Bollinger Bands: Highlights price volatility and potential breakouts.
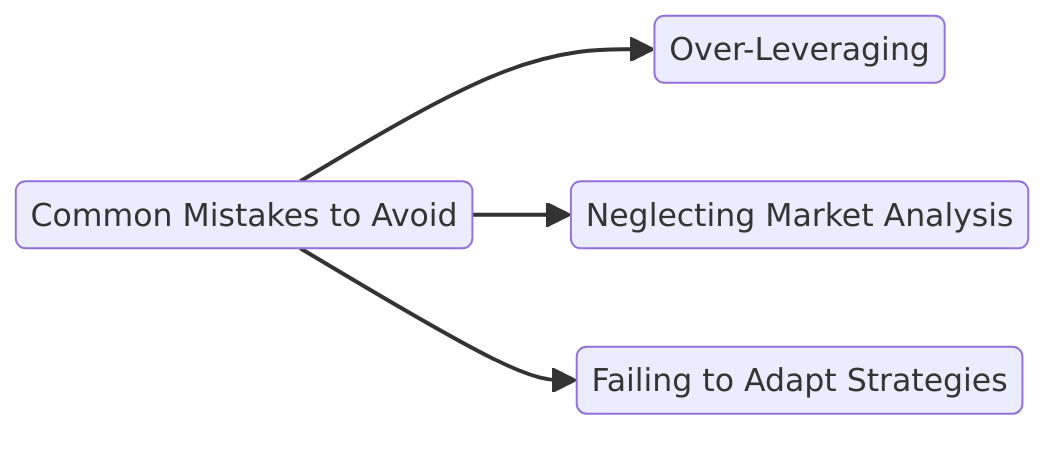
Common Mistakes to Avoid
1. Over-Leveraging
Taking excessive leverage can amplify losses as easily as profits.
Example: A 10x leverage position can lead to a complete loss if Bitcoin’s current price even moves against the trade by just 10%.
2. Neglecting Market Analysis
Entering trades without thorough research increases the risk of poor outcomes. Always analyze both fundamental and technical factors before acting.
3. Failing to Adapt Strategies
Rigid adherence to a single strategy may result in poor performance as market conditions evolve. Flexibility is crucial for sustained success during market fluctuations.
Conclusion
Day trading Bitcoin requires a blend of fundamental and technical analysis, effective risk management, and the disciplined use of tools and strategies. Understanding macroeconomic trends, market sentiment, and key risk factors allows traders to make informed decisions in volatile markets. By combining a structured approach with adaptive strategies, traders can navigate the complexities of Bitcoin trading while minimizing risks and maximizing opportunities.
If you are interested in what the difference between Bitcoin and Bitcoin Cash is, you should definitely consider reading this article.
Sidebar rates
