ADX (Average Directional Index)
Last Update: February 4th, 2025
Have you ever entered a trade, only to realize the trend had already run its course?

Many forex trading strategies help predict market direction—whether bullish or bearish—but often fall short in measuring the strength of that trend. This can lead to trades that move in the expected direction but yield minimal profits.
This is where the Average Directional Index (ADX) comes in. The ADX is a powerful technical indicator designed to measure trend strength, helping traders avoid weak setups and focus on high-probability opportunities. Whether you’re trading forex, stocks, or commodities, the ADX can be a valuable addition to your trading toolkit.
However, the ADX is not a standalone strategy. It tells you how strong a trend is, but it doesn’t indicate the trend’s direction. That’s why it works best when combined with other technical indicators or trading strategies that identify bullish or bearish setups.
What Is the Average Directional Index (ADX)?
The Average Directional Index (ADX) is a widely used technical indicator designed to measure the strength of a trend in financial markets. While many indicators help identify the direction of price movement, the ADX specifically focuses on determining how strong or weak a trend is—regardless of whether it’s bullish or bearish.
Traders and investors rely on the ADX to confirm trends, filter out false signals, and make better-informed trading decisions. It’s an integral part of the Directional Movement System, which also includes the +DI (Positive Directional Indicator) and -DI (Negative Directional Indicator). Together, these components help identify not only the presence of a trend but also its direction and momentum.
Importantly, the ADX is a lagging indicator, meaning it responds to price changes after they occur. This makes it more reliable for confirming trends rather than predicting them in advance.
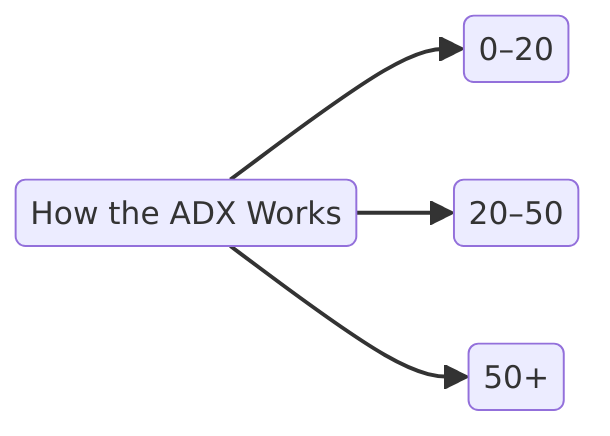
How the ADX Works
The ADX ranges from 0 to 100, with readings offering insight into market conditions:
- 0–20: Indicates a weak or non-existent trend—markets are likely moving sideways.
- 20–50: Shows a strengthening trend. The higher the value, the stronger the trend.
- 50+: Signals an extremely strong trend—whether bullish or bearish.
A low ADX suggests it’s time to stay out of the market or close existing trades, as sideways price action often results in poor performance. Conversely, a high ADX indicates a strong, fast-moving trend, presenting potential trading opportunities.
Key Point: The ADX measures trend strength, not direction. You’ll still need to analyze price action or use directional indicators to determine whether to go long or short.
Real-World Example
Consider a chart where the ADX is plotted alongside price action:
- In the first phase, a strong bearish trend is evident, with the ADX rising above 50—confirming strong momentum.
- As the trend fades and price consolidates sideways, the ADX drops below 20, signaling reduced volatility and trend exhaustion.
Had you relied on the ADX, it would’ve helped you exit at the right time—avoiding unproductive trades in a flat market.
Why Use ADX in Your Trading?
When combined with other forex strategies, the ADX provides a critical edge. It helps you:
- Identify when trends are gaining or losing momentum
- Avoid false breakouts in weak market conditions
- Improve trade timing by focusing on high-conviction setups
Mastering the ADX won’t just enhance your technical analysis—it will help you focus on trades that truly matter.
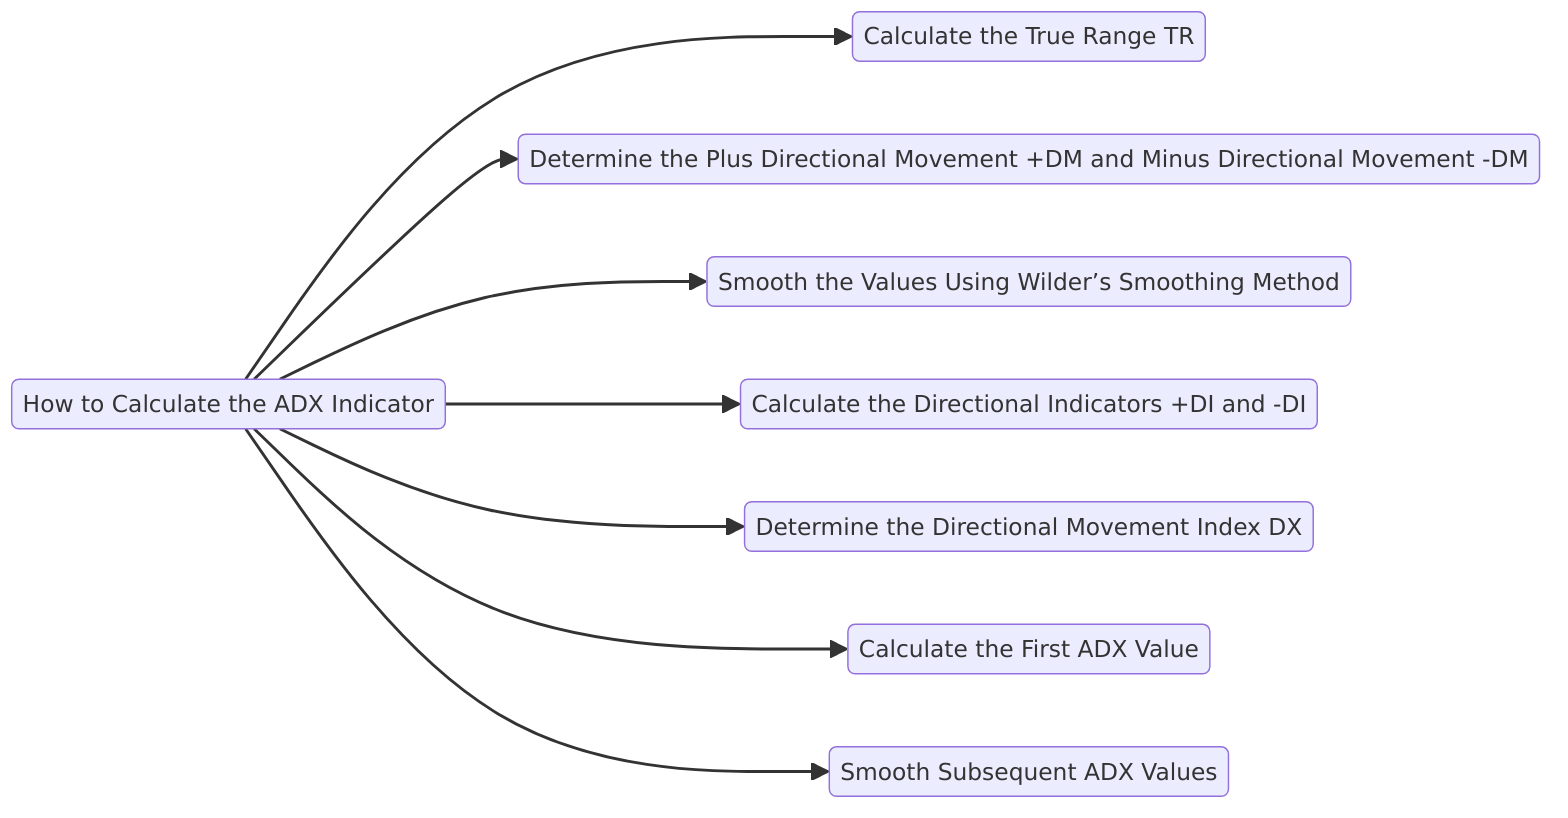
How to Calculate the ADX Indicator
While most trading platforms automatically calculate the ADX, understanding the process behind it helps traders interpret the signals more effectively. Here’s a step-by-step breakdown:
- Calculate the True Range (TR):
- TR = The greatest of:
- Current High − Current Low
- Absolute value of (Current High − Previous Close)
- Absolute value of (Current Low − Previous Close)
- TR = The greatest of:
- Determine the Plus Directional Movement (+DM) and Minus Directional Movement (-DM):
- +DM = Current High − Previous High (if positive; otherwise, 0)
- -DM = Previous Low − Current Low (if positive; otherwise, 0)
- If both +DM and -DM are positive, use the larger value and set the other to zero.
- Smooth the Values Using Wilder’s Smoothing Method:
- Apply a 14-period smoothing (commonly used) to TR, +DM, and -DM.
- Calculate the Directional Indicators (+DI and -DI):
- +DI14 = (Smoothed +DM ÷ Smoothed TR) × 100
- -DI14 = (Smoothed -DM ÷ Smoothed TR) × 100
- Determine the Directional Movement Index (DX):
- DX = (|+DI14 − -DI14| ÷ (+DI14 + -DI14)) × 100
- Calculate the First ADX Value:
- ADX = 14-period average of the DX values.
- Smooth Subsequent ADX Values:
- ADX = [(Previous ADX × 13) + Current DX] ÷ 14
This smoothing process ensures the ADX responds steadily to price movements, reducing noise and false signals.
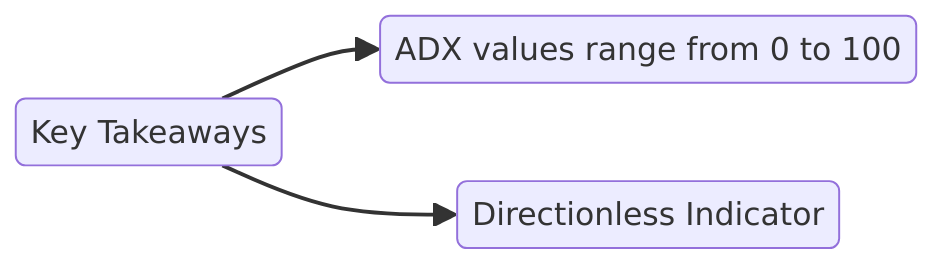
Key Takeaways:
- ADX values range from 0 to 100:
- 0–20: Weak or no trend (sideways market)
- 20–50: Strong trend (increasing momentum)
- 50+: Extremely strong trend (potential trend exhaustion approaching)
- Directionless Indicator:
The ADX measures trend strength, not direction. To determine if the trend is bullish or bearish, traders look at the +DI and -DI lines alongside the ADX.
Understanding the ADX calculation process enhances your ability to interpret its signals, helping you make more confident trading decisions.
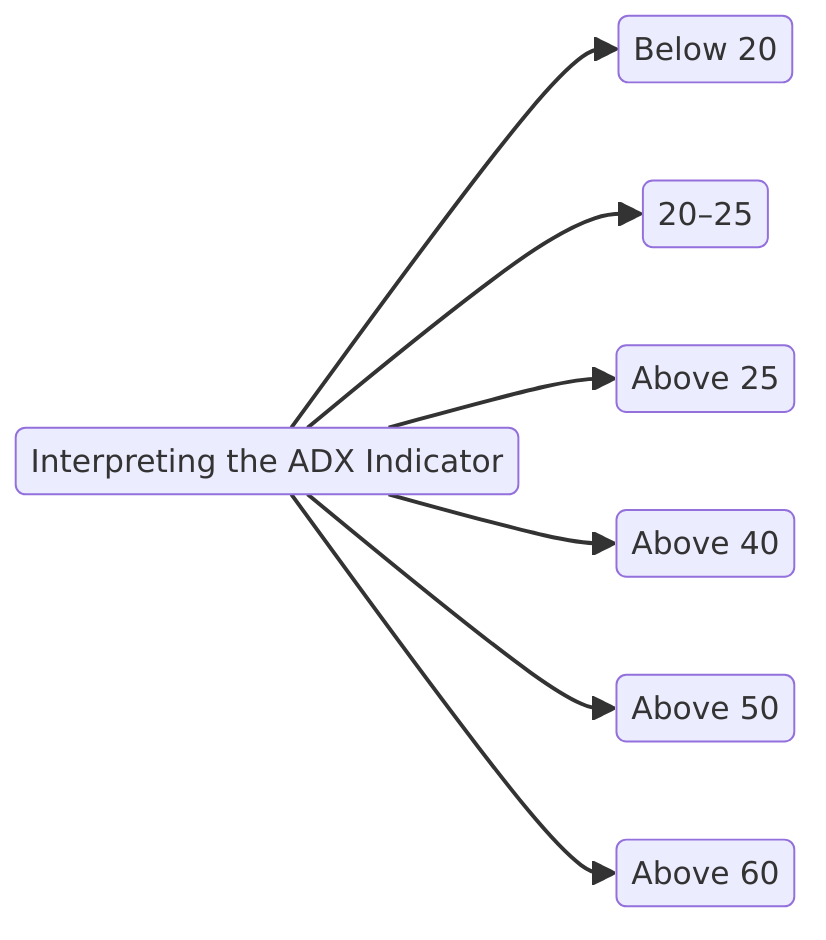
Interpreting the ADX Indicator
Understanding how to interpret the Average Directional Index (ADX) is key to evaluating the strength of market trends. The ADX doesn’t indicate the direction of the trend—whether bullish or bearish—but rather how strong that trend is. Here’s how to decode ADX readings:
- Below 20: Signals a weak trend or a ranging market, where price movements are minimal and inconsistent. This often suggests a period of consolidation with low volatility.
- 20–25: Indicates a developing trend, though not strong enough to confirm a breakout. Traders may want to wait for further confirmation before entering trades.
- Above 25: Confirms a strong trend is in place. This is where traders start to consider trend-following strategies.
- Above 40: Reflects a very strong trend, whether upward or downward. This level suggests high momentum and increasing market participation.
- Above 50: Indicates an extremely strong trend with significant price movement. Trends at this level often attract institutional interest.
- Above 60: Suggests an intensely strong trend, which may also hint at trend exhaustion as extreme momentum can be unsustainable.
Trend Reversal Signals
- Falling ADX with Rising Prices: May signal a weakening uptrend, indicating potential for a reversal or a consolidation phase.
- Rising ADX with Falling Prices: Suggests strengthening bearish momentum, often preceding continued downside movement.
By monitoring these shifts, traders can adjust their strategies to either ride strong trends or prepare for possible reversals.
Using the Positive and Negative Directional Indicators (+DI and -DI)
While the ADX measures trend strength, it’s the Positive Directional Indicator (+DI) and Negative Directional Indicator (-DI) that determine the trend’s direction. Together, they provide actionable trade signals:
- +DI (Positive Directional Indicator): Measures the strength of upward price movements.
- -DI (Negative Directional Indicator): Measures the strength of downward price movements.
How to Generate Trade Signals:
- Buy Signal: Occurs when the +DI crosses above the -DI, signaling that bullish momentum is gaining strength and an upward trend may develop.
- Sell Signal: Occurs when the -DI crosses above the +DI, suggesting that bearish pressure is increasing, and a downward trend may follow.
Confirming Signals with ADX:
- When the ADX is above 25, it confirms that the trend (bullish or bearish) is strong, increasing the reliability of the trade signal.
- If the ADX is below 20, the trend is weak or absent, and trade signals from +DI/-DI may be less reliable, often leading to false breakouts.
Example for Practical Application:
- Bullish Setup:
- +DI crosses above -DI
- ADX is rising and above 25 → Confirmed strong uptrend → Consider long positions.
- Bearish Setup:
- -DI crosses above +DI
- ADX is rising and above 25 → Confirmed strong downtrend → Consider short positions.
By combining the ADX with the +DI and -DI, traders can improve their market analysis, identify high-probability trade setups, and manage risks more effectively.

In the EUR/USD chart above, the ADX effectively highlights trend strength. During the strong downtrend, the ADX rises above 50, confirming strong bearish momentum. As the trend weakens, price action shifts into a ranging trend, and the ADX drops below 20, indicating a lack of clear direction.
This example shows how traders can use the ADX to identify when to ride strong trends and when to avoid low-momentum, sideways markets, reducing the risk of false breakouts.
Conclusion
The Average Directional Index (ADX) is an invaluable tool for traders seeking to gauge trend strength and optimize their trading strategies. While many technical indicators focus on identifying the direction of price movements, the ADX specializes in measuring the intensity of those trends—regardless of whether they’re bullish or bearish. This helps traders avoid weak, choppy markets and focus on strong, high-probability setups.
However, the ADX should not be used in isolation. Since it doesn’t indicate trend direction, combining it with other technical indicators—such as moving averages, RSI, or price action strategies—can enhance decision-making. Its true power lies in confirming trends, filtering out false breakouts, and improving the timing of trade entries and exits.
By understanding how to interpret ADX readings, leveraging the +DI and -DI lines, and recognizing trend reversals, traders can gain a strategic edge in volatile markets. Whether you’re trading forex, stocks, or commodities, the ADX can help you identify when to ride strong trends and when to step aside, ultimately leading to more informed, confident trading decisions. Combining the ADX indicator with your other forex trading strategies can give you just the edge you need to increase your profits.

Frequently Asked Questions (FAQs)
1. What is a good ADX value to confirm a strong trend?
A reading above 25 typically indicates a strong trend. The higher the value, the stronger the trend. For example, ADX values above 40 reflect very strong trends, while values above 50 suggest extreme market momentum.
2. Can the ADX indicator predict trend direction?
No, the ADX only measures the strength of a trend, not its direction. To determine whether the trend is bullish or bearish, traders analyze the +DI (Positive Directional Indicator) and -DI (Negative Directional Indicator) alongside the ADX.
3. Is ADX effective in all market conditions?
The ADX works best in trending markets to confirm the strength of price movements. In range-bound or sideways markets, ADX values typically fall below 20, signaling weak trends where trend-following strategies may be less effective.
4. How do I generate buy or sell signals with ADX?
- A buy signal occurs when +DI crosses above -DI and the ADX is above 25, confirming strong bullish momentum.
- A sell signal happens when -DI crosses above +DI with the ADX above 25, indicating a strong bearish trend.
5. What are common mistakes when using ADX?
- Relying solely on ADX: Since it doesn’t show trend direction, using it without other indicators can lead to poor trade decisions.
- Ignoring weak trends: Entering trades when ADX is below 20 often results in false breakouts or choppy price action.
- Overlooking trend reversals: A declining ADX while prices rise can signal an impending reversal, which traders may miss if focused only on current strength.
By understanding how to interpret and apply the ADX effectively, traders can improve their risk management, enhance trade timing, and capitalize on strong trends with greater confidence.
Sidebar rates
