The US Dollar used to exchange for nearly 2 Singapore Dollars SGD in the early 1990s, but since then, the SGD has been gaining ground against the US Dollar, sending this pair lower. One of the reasons for this is the surge in the Chinese economy in the last three decades, and the SGD has benefited from this, since Singapore’s economy is closely connected to the Chinese economy, which pushes the SGD up and sends the USD/SGD lower.
Current USD/SGD Price: $
Recent Changes in the USD/SGD Price
| Period | Change ($) | Change % |
| 30 Days | +0.007 | +0.05% |
| 6 Months | -0.07 | -5.1% |
| 1 Year | -0.015 | -1.1% |
| 5 Years | -0.05 | -3.6% |
| Since 2000 | -0.33 | -24.1% |
There was a pullback in the late ‘90s and early 2000s, sending this pair up from 1.40 to 1.85, partly due to the Japanese economic crisis back then. But the downtrend resumed again, and this pair remained bearish until 2010, which was followed by a retrace higher until 2015. Since then though, the USD/SGD has been trading sideways, and after the increase in the SGD in recent months, this pair is headed for the bottom of the range. But, the 100 SMA seems to be holding, so the range will likely continue, offering some good trading opportunities in the long run.
| USD/SGD Forecast: H2 2021 | USD/SGD Forecast: 1 Year | USD/SGD Forecast: 3 Years |
| Price: $ 1.40 Price drivers: COVID-19, US elections, Technicals, | Price: $ 1.45-46 Price drivers: Post US Elections, US-China trade war, Technicals, FED | Price: $ 1.55 – 1.60 Price drivers: Fundamentals US and Singapore, China’s military advance on Singapore, Global politics |
USD/SGD Live Chart
USD/SGD Price Prediction for the Next 5 Years
SGD Benefiting From Chinese Economic Boom
Besides the expansion of the Chinese economy, which has helped the economy of Singapore, the SGD is somewhat correlated to the Chinese Yuan CNY, therefore benefiting from it too, as has been evident in the last few months, as China has left the coronavirus behind, while the pandemic continues to rage in the US. But, the benefit goes a long way back, and probably further into the future.
The Chinese economy has gone from an outsider of G20 in the 1990s to a second position on a global scale. That is one of the main reasons for the 30-year-long bearish trend in this pair. The Chinese economy will continue to grow and the economy of Singapore will continue to benefit from it, which in turn means that the Singaporean Dollar will continue to increase, sending the USD/SGD lower. However, the trade war between the US and China complicates the situation a little, since it will dent the economic growth of China, but overall, this is a long-term minus for this pair.
Central Bank of Singapore and COVID-19
The coronavirus has affected all economies around the globe this year, and the economy of Singapore is expected to contract around 1-4% in 2020, because of the COVID-19 measures. CPI inflation is also expected, averaging between -1% and 0% this year. However, China and East Asia seem to have left the coronavirus pandemic behind now, and the economic situation has improved considerably, both in China and Singapore.
The SGD lost around 12 cents during Q1, as Singapore and China were putting restrictions in place to curb the virus, and the USD/SGD surged from 1.3450 to 1.4650. But then the virus started to spread in Europe and the US, and the USD/SGD reversed down, and it has remained bearish since then. The extreme measures taken by the Monetary Authority of Singapore (MAS), which acts as the central bank, have also helped. They cut the slope (interest rates) to 0%, from around 1.75% earlier this year, and introduced $100 billion in coronavirus aid. So, this pair remains bearish now, although it is approaching the bottom of the range.
USD/SGD Technical Analysis – Will the Bottom of the Range Hold
As mentioned above, the USD/SGD was trading at around 2 in the early ‘90s, but then it headed down again, as China started to pick up speed, and until 1997, the 20 SMA (gray) provided resistance on the monthly chart. This showed that the pace of the decline was quite strong. For the following 5 years, we saw a retrace higher, to above 1.85, as the Japanese economic crisis scared the East Asian markets, and the 20 SMA turned into support. The bearish trend resumed in 2002, and this time the 50 SMA (yellow) came into play as resistance during pullbacks. The USD/SGD retraced higher again from 2012 until 2015, but since then, it has been trading sideways, with the 100 SMA (green) turning into support now, while the resistance zone, at around 1.45, forms the top.

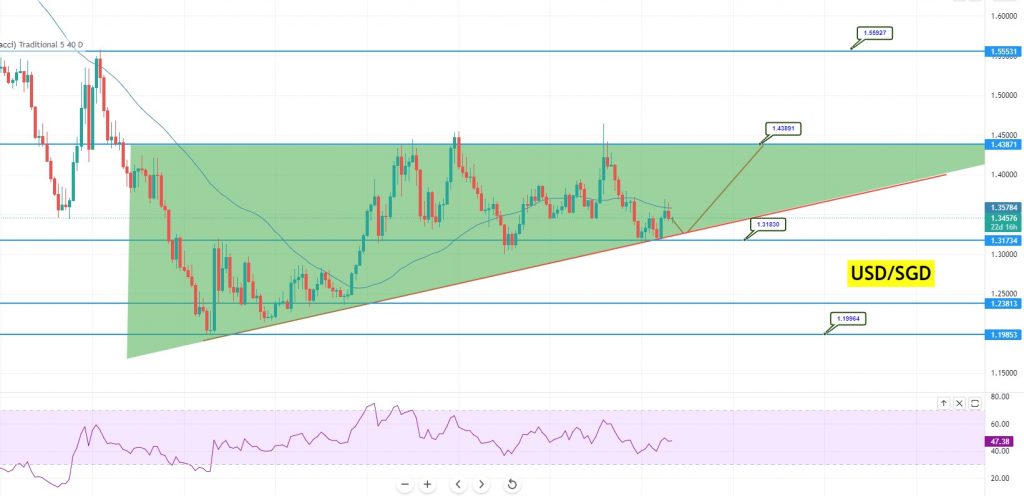
On the technical front, the USD/SGD is gaining support at the 1.3180 level. On the monthly timeframe, it’s forming an ascending triangle pattern that’s extending support at the 1.3180 mark. The USD/SGD pair has tested the 50 periods simple moving average. Furthermore, the USD/SGD has formed a tweezers top pattern below 50 periods simple moving average.
On the monthly timeframe bullish crossover of 50 periods, SMA (simple moving average) is likely to lead USD/SGD price towards the next resistance level of 1.4389 level. On the flip side, the break out of the 1.3183 support level is likely to lead the currency pair towards the next support level of 1.2380 levels. Whereas the break out of 1.2380 level is likely to open USD/SGD towards the next support level of 1.1964 level
The MAs turned into resistance in September
Speaking of support and resistance, the pair may find next resistance around 1.3637 and a bullish crossover above this level is likely to lead the USD/SGD currency pair towards the resistance level of 1.4389 level.
Taking a look at the monthly time frame the USD/SGD currency pair is trading with the bearish bias as its holding below 50 periods simple moving average. The 50 period moving average is suggesting a selling trend in the currency pair. Moreover, if we take a look at RSI, the leading indicator, it suggesting selling trends in the currency pair.
That’s the idea is to look for sell trades below 1.3180 level with a target of 1.2381 and 1.1985 levels. Conversely, the bullish crossover above the 1.3580 level is likely to lead the currency pair towards the 1.4389 level. Good luck!
Updated: September 07/09/2021


