Ankr/USD – Forecast Summary
| Forecast: 2022 Price: $0.215-$0.35 Price Drivers: Growing Web 3.0, Crypto sentiment,The growing DeFi ecosystem | Forecast: 2 Years Price: $0.4-$0.55 Price Drivers: Growing Web 3.0, Crypto sentiment,The growing DeFi ecosystem | Forecast: 3 Years Price: <$0.60 Price Drivers: Growing Web 3.0, Crypto sentiment,The growing DeFi ecosystem |
Ankr Historical Price Analysis
Ankr (ANKR/USD) began trading in 2019 at around $0.01344 with $20 million trading volumes. The pair remained subdued below $0.02 up to the first half of 2021, when a positive sentiment pushed the price in upward momentum. ANKR/USD surged in March 2021 from trading at $0.035 to an all-time high of $0.21 as of March 28. The price level was not sustainable, and the pair came under a bearish momentum, which took it to a low of $0.07 as of June 20, with 24-hour trading volumes of $25.05m.
ANKR/USD moved from around $0.12 on April 25 to $0.18 as of May 1, but the bears took the price to $0.05 by June 22. ANKR/USD began the month of November trading at $0.1201 with trading volumes of $2.69 billion. The pair traded at $0.12 on November 22, defying an industry-wide crypto rout that saw most altcoins plummet.
Currently Ankr ranks at the 103rd spot in crypto ranking with a market capitalization of $1,078,281,011. There are 8.16 billion ANKR tokens in circulation, with the maximum supply set at 10,000,000,000 coins. The capped supply of the crypto token, coupled with strong demand, means that ANKR/USD could rise to new levels in the future as long as protocol adoption continues.
Fundamental Analysis
Introduction to Ankr
Ankr was founded in 2017 as a distributed cloud computing solution that provides shared resources for affordable blockchain node and hosting solutions. The network allows enterprise clients and developers to deploy blockchain nodes at an affordable price compared to public cloud providers. Ankr protocol aims to make the hosting of a node more accessible. Ankr has launched over 8,000 infrastructure nodes, processing over $1 billion transactions monthly with over 25,000 endpoints.
Ankr supports other blockchain networks such as Bitcoin, Ethereum, and Cardano. The protocol uses the Proof-of-Useful Work algorithm in the blockchain validation process with a reputation-based system.
Ankr’s proprietary infrastructure works independently and is powered through geographically distributed data centers for stability and resilience. ANKR is the Ethereum token of Ankr that is used to pay for node deployment, API services, on-chain governance participation, and insurance for the network participant fund. Another feature of blockchain is the Ankr Staking, which lets users stake Ether and earn a return.
Chandler Song and Ryan Fang founded Ankr at Berkeley University with seed funding from their bitcoin investment.
Recent Ankr Price Changes
| Period | Change ($) | Change % |
| 1 Week | -0.0070 | -5.24% |
| 1 Month | +0.0338 | +36.03% |
| 3 Months | +0.0279 | +27.98% |
| 6 Months | +0.0061 | +5.06% |
| 1 Year | +0.1185 | +1,286% |
This ad promotes virtual cryptocurrency investing within the EU (by eToro Europe Ltd. and eToro UK Ltd.) & USA (by eToro USA LLC); which is highly volatile, unregulated in most EU countries, no EU protections & not supervised by the EU regulatory framework. Investments are subject to market risk, including the loss of principal.
ANKR Live Chart
Ankr continues to expand its infrastructure services and provide valuable DeFi solutions to attract developers and users to its ecosystem. The blockchain has been adding support for more blockchains to make node infrastructure and staking more accessible. Ankr claims to power the crypto economy by leveraging idle computing power from data centers and devices. Ankr protocol provides support to over 45 chains and has $350 million in Total Value Locked (TVL).
In October, the blockchain protocol unveiled a decentralized web service, Ankr V2, to enhance the development of Web3 and empower creators to build multi-chain systems. The network also announced a grant of $10 million to support the advancement of the network. Currently, Ankr is listed on major exchanges like Coinbase and Binance. As more exchanges list the token, prices will gain upward momentum, and trading volumes will increase.
Our Ankr forecast is quite conservative based on the past price action. We consider $0.215 as the potential low for ANKR/USD for early 2022 as this is the level currently acting as resistance. Therefore, it could turn out into a support area in 2022 after a break above it. Ankr could surpass the all-time high price driven by its innovative approach to blockchain technology. We believe that Ankr would grow steadily to around $0.60 in the next three years.
Fundamental Developments Supporting the Future Growth of Ankr
We remain bullish on Ankr in the long term as long as it remains supported by the technical and fundamental analysis. The protocol’s commitment to providing valuable solutions in node infrastructure, DeFi, and staking to the crypto industry could grow the ecosystem exponentially. Ankr’s use of idle computing resources remains valuable with the growing adoption of cryptocurrencies and blockchain technology.
The popularity of cloud computing solutions is another key factor that drives the adoption of Ankr. The approach could attract more businesses with significant cost savings in cloud services. Big corporations like Amazon and Google currently control most of the cloud computing space in a centralized manner.
The Ankr protocol aims to democratize the internet and give users control over their data and applications. Decentralization is the key fundamental of a blockchain network that gives power to the users.
With the supply of ANKR tokens in circulation currently at 82%, the demand and supply imbalance could potentially take the price upwards. If the protocol continues to build innovative partnerships with other networks, the wider adoption could increase the price. Another important growth factor is the Ankr community, which drives market sentiments. With the continued support of the community’s activities in the form of grants and hackathons, the protocol will grow.
Factors that Could Hinder the Adoption of Ankr
Ankr faces regulatory risks both in the near term and in the long term. Regulators across different jurisdictions are still trying to figure out the best way to regulate the emerging Decentralized Finance space. The US Securities Exchange Commission (SEC) recently said that the lack of transparency and pseudonymity in the DeFi space was a concern that needed to have policies.
Competition from established blockchains such as Solana and Ethereum in the DeFi space could also impact the adoption of Ankr by developers. The crackdown of the crypto sector in China has been a setback in the recent past. If we see similar crackdowns in other markets in the near term or the long term, then the upward trend of Ankr could be affected.
The Ankr protocol largely depends on the overall crypto market. As long as crypto adoption continues to go mainstream, Ankr could have a steady growth path. However, if the market faces challenges and the adoption is affected, the reverse is inevitable.
Ethereum (ETH) Price Prediction For 2022: The $5,000 Level is the Next Target
Bitcoin (BTC) Price Prediction For 2022: BTC/USD Targeting $100,000
ANKR/USD Technical Analysis
Monthly Chart Outlook- $0.0777 Support Keeping Sellers Out
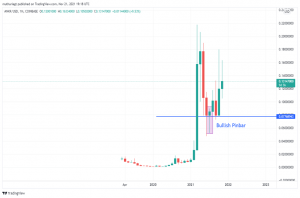
The monthly chart above shows that ANKR/USD is already enjoying strong support at the $0.0777 level. We can see a long bullish pin bar that formed at the support before prices pushed higher. The bullish pin bar happens after a crash in May and June. Given that the bullish pin bar formed on a longer time frame, monthly chart, we expect the level at $0.0777 to continue supporting ANKR/USD. Nonetheless, ANKR/USD is under pressure as it is currently trading well below its all-time high of above $0.21. Also, prices can be seen retreating towards the support, which means we could see a short-term and medium-term drop in prices. Looking at the monthly chart, the area around $0.18 is turning into resistance, and if we are to see significant upsides, then ANKR/USD must clear the area around $0.18.
ANKR/USD Weekly Chart – 50 MA and 100 MA Support Higher Prices
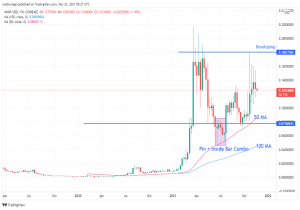
ANKR/USD bullish signals get stronger when we switch to the weekly chart. Above, we can see a bullish pin bar and several insider bars at the $0.0777 support. The price broke to the upside from the bullish pin bar and inside bar combo. Since then, ANKR/USD has continued to retest the $0.0777, which has become a reference point to our prediction of further rise. Nonetheless, the 50-moving average (red) and 100 moving average (blue) support ANKR/USD. Although the weekly chart also shows the pair facing some pressure to the upside, we expect any price drop to be rejected at the point it meets the 50 MA. A break below the 50 MA will see ANKR/USD at the $0.077 support. However, with the price above both moving averages, it could reverse quickly to the upside and continue to reach new levels highlighted in the forecast. From the weekly chart, the area around $0.18 is becoming a new resistance for ANKR/USD, and we need to see a clear breakout above the level to expect a further surge in prices.
ANKR/USD Daily Chart – Moving Averages Support Price but Consolidation Underway
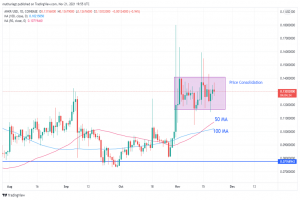
Things get a little bit twisted when we examine ANKR/USD on the daily chart. Both 50 MA and 100 MA support prices and are far below the current level. However, ANKR/USD lacks a directional movement, as seen from the consolidation area within $0.116 and $0.14. Still, we do not consider the consolidation a loss of bullish momentum, as prices have rejected any drop at the lower bound of the consolidation. Besides, with ANKR/USD remaining above the moving averages, we maintain a bullish view as long as the $0.0777 support remains. Coincidentally, at the time of writing, major cryptocurrencies were showing weaknesses. Therefore, with ANKR/USD having dropped by a small percentage compared to peers and remaining within the consolidation zone, we can only predict a further surge in prices. In the next few days, the daily chart can be a reference point in ANKR/USD. If prices break above the consolidation area, we will be ready for a new bullish move that could reach higher levels, in line with our forecast.

