Gold – Forecast Summary
| Gold Forecast: H1 2021 Price: $1,600 – $1,650 Price drivers: Technical pullback, Second wave of COVID-19, Safe haven retreat | Gold Forecast: 1 Year Price: $1,350 – $1,400 Price drivers: Post COVID-19, Hawkish central banks, USD reversal, Positive risk sentiment | Gold Forecast: 3 Years Price: $2,000 Price drivers: Economic Recovery, Post coronavirus, Tighter monetary policies, Higher bond yields |
When we posted our long-term analysis for GOLD, the price was in the middle of an extremely bullish trend. The sentiment was really negative in financial markets, which was keeping safe havens in demand. The fundamental situation hasn’t changed much since then: developed economies are still struggling, the coronavirus is still hanging around, the world is going through great political and economic change, but the demand for safe-haven commodities has declined.
The gold’s prices have dropped $40, losing around 2.24% during the time span of 6 months. During the past year, gold prices plunged over $200, losing almost 11.19% after placing a high of $2,074.
Recent Changes in the Gold Price
| Period | Change ($) | Change % |
| 6 Months | -40.65 | -2.24% |
| 1 Year | -203.05 | -11.19% |
| 3 Years | +430.05 | +23.70% |
| 5 Years | +812 | +77.6% |
| Since 2000 | +1,623 | +662.2% |
Gold was on a bullish trend from the middle of 2018, which picked up the pace further in 2020, as a result of everything that happened during the year. The coronavirus break out in the West sent gold surging higher, and this was followed by another surge in summer, as the USD kept declining. But, everything reversed in the second week of August, and gold has been trending down since then.
The trend hasn’t been particularly strong, but that comes despite the fact that the USD has been extremely bearish this year. On top of that, the investor sentiment has remained negative, but safe-haven commodities such as gold and silver have been declining. This suggests that they will decline faster if the global economy improves and the sentiment reverses, and when the USD turns bullish, which might come after the economic stimulus package is passed by the US Senate.
Gold Live Chart
Gold Price Prediction for the Next 5 Years
Gold has been extremely bullish during the last two years, due to the escalating trade war between the US and China, which kept the sentiment negative in financial markets, as we mentioned in the Gold Price Forecast for 2020. The uptrend only picked up pace with the breakout of the coronavirus in Europe in March, but the break we had during summer, and the associated economic bounce, turned the sentiment positive in financial markets and negative for safe havens. That turned gold bearish, and the trend has continued until the end of 2020, despite the new COVID-19 restrictions. This suggests further bearish momentum for gold in 2021, as the world recovers from what happened in 2020.
The Negative US Dollar Correlation Has Been Lost
The relationship to the US dollar is important for commodities since they are mostly traded in USD. The US dollar and gold are negatively correlated most of the time, so that when the USD advances, gold falls, and vice versa. The USD was very weak in 2020 and gold was rallying higher until August. There were other factors for the strong bullish move, such as the global economic crash, the coronavirus etc, which we will analyze below, but the USD correlation played its part in fuelling the bullish move.
But, the situation has changed since the second week of August, turning gold and silver bearish. The USD has remained bearish, apart from a slight retrace in September and October, but these metals have kept declining. This points to a further bearish move when the decline in the USD ends and it finally turns bullish. There are indications that this will happen sometime in Q1 of 2021, probably sooner rather than later, as we will explain below, so the downtrend in gold will probably continue in 2021.
While global investors do manage to run with the US dollar through periods of uncertainty, this type of movement has been muted over the previous year, despite the trade war with China. They preferred to go with gold.
This year, the most significant impact on gold prices has been driven by the US monetary policy, which is controlled by the Federal Reserve. Interest rates impact bullion prices significantly, due to the factor known as “opportunity cost.” Opportunity cost is the idea of giving up a near-guaranteed gain in one investment to achieve a greater gain in another. According to the historical outlook, a strong negative correlation exists between interest rates and gold prices.
However, the sharp gains in the gold prices can be attributed to the low-interest rates from all central banks across the world, which were driven down in order to curb the economic slowdown triggered by the lockdowns that were induced by the coronavirus pandemic. The US Federal Reserve cut their interest rates from 1.75% to 1.25% in March, which drove sharp selling in the US dollar and triggered a bullish bias for the precious metal, gold. Later, on March 16, the Federal Reserve decided to cut the rate even further, from 1.25% to 0.25%, considering the massive outbreak of COVID-19, which made gold even more bullish this year.
Federal Reserve Monetary Policy and Upcoming US Stimulus Package
Safe havens and low interest rates also have a strong history of negative correlation. When the Federal Reserve (FED) lowers the interest rates, the price of gold increases. One of the reasons is the excess of spare cash in the economy and around the globe, since FED actions affect the entire global economy. Some of that cash will flow into gold. Another reason is the drop in Treasury Bond yields, which make lower profits, thus making investors turn to safe-havens.
The FED lowered the interest rates aggressively in March 2020, which kept safe havens like gold in strong demand. The FED has been keeping rates unchanged at the lower boundary between 0.00% and 0.25%, but gold has been declining since August nonetheless. That is not a positive sign, especially if the FED decides to start turning hawkish at some point.
The latest FOMC statement on December 18, and the ensuing press conference with chairman Jerome Powell, suggests that the FED has dropped the drama. Most major central banks and governments have been really dramatic during 2020, as a result of the economic melt-down, but, the last FED meeting gave the impression that the FED is not getting any more dovish, and they see some light at the end of the tunnel.
They didn’t suggest a reversal in the monetary policy any time soon, but it might come if the US economy, which is holding the pace of the recovery well compared to Europe, improves further. The fundamentals of the US economy remain solid, as the data has shown, while the expected economic stimulus package will stimulate further spending from the US consumer, which will help improve the economy even more. So, as dark as the situation might look now, the FED could start sounding less dovish and increasingly hawkish in the coming months, which will be a negative factor for gold.
The Market Sentiment and the Global Economy Should Have Been Positive for Gold
As we know, commodities are really sensitive to the sentiment in the financial markets. Risk commodities like oil, gas, copper etc. tend to rally when the sentiment is positive, meaning that traders and investors feel like taking more risks by investing in them. When the market sentiment is negative, safe haven commodities such as gold and silver tend to rally, since investors turn to them as a safe place to store cash. That was the reason why gold was extremely bullish during the first half of 2020, until August.
But as we mentioned, the trend changed back then. The global economy started to rebound really strongly in Q3, as the data in late July and August shows, which improved the market sentiment. That was probably what started the reversal back then. Traders thought that the economic darkness from the lock-downs was over and started to move away from safe-havens.
But the sentiment deteriorated again in late autumn, and the global economy started to weaken as well. The economy of the Eurozone has turned tail, particularly in terms of services, which have been in recession since September, while the consumer confidence dived deeper into negative territory. The UK economy is probably also heading towards another recession, at least with regard to the service activities, which fell below neutral in November.
The Chinese economy, on the other hand, is booming, and it is keeping the risk sentiment positive, with help from the second round of economic stimulus programs from the EU, the US government, after US President Donal Trump signed the $ 900 covid bill, the FED, the ECB, and other major central banks. This is negative for safe havens and it has been another factor that has kept gold bearish in the last several months. The sentiment is expected to improve in 2021 and that should keep gold on the back foot.
Will the End of COVID-19 Mean the End, or Will it Trigger a Bullish Run in Gold?
The COVID-19 outbreak has had a massive impact on everything, not just the financial markets. It has had an impact on global politics, on businesses, on social life, obviously, with all the social distancing, and of course, gold was no exception. The first reaction when the coronavirus broke out in Europe was a $ 250 decline, from $ 1,700 to $ 1,450, but that was more of a USD move, as traders turned into the US Dollar during the initial panic.
After that, the markets came to their senses, and they had turned to safe havens by the middle of March. Gold turned massively bullish and the uptrend continued to pick up pace until August, but then the coronavirus retreated in the West during summer, and the world reopened again in June, which can be seen from the economic results in the August data. This was the beginning of the end of the bullish trend in gold, as mentioned above.
However, the coronavirus has resurged in Europe and the US once again, and the restrictions have increased, yet gold is not taking any notice. The trend has remained bearish since August and the retraces higher have come during periods when the USD was extremely weak. This shows that markets are getting used to the coronavirus, so it no longer has as much of an impact on gold.
Monero Coin (XMR) Forecast for 2021: Will the XMR/USD Continue to Rise in 2021?
Ethereum (ETH) Price Prediction For 2021: Will Buyers Break 2017 Highs Soon?
Gold Price Forecast – Technical Analysis – Symmetrical Triangle Support at $1,756
Looking at the weekly chart, we can see that gold started turning bullish after testing the support level of 1,756 level. On the weekly timeframe, the precious metal gold has closed a symmetrical triangle pattern that’s suggesting indecision among investors in the longer run. However, the short-term traders are taking benefit of a bullish rally. At the moment, gold is trading at 1,812 level, having formed three bullish candles on the weekly timeframe.
These bullish candles are closed above the 1,755 support level, that’s suggesting the odds of bullish trend continuation in gold. On the higher side, the downward trendline of the symmetrical triangle pattern is extending resistance at 1,846 level. At the same area of 1,846, the 50 periods exponential moving average is also likely to extend resistance.

The 50 EMA is acting as resistance on the weekly chart
The technical indicators like MACD and RSI are tossing above and below 0 and 50 levels, respectively. These demonstrate neutral bias among investors, therefore, gold can continue to trade choppy with a broad trading range of 1,846 – 1,755 level. Breakout of this range will determine further trends in the gold prices. A bullish breakout of 1,846 level can lead gold prices towards the next resistance level of 1,875 and 1,914 levels.

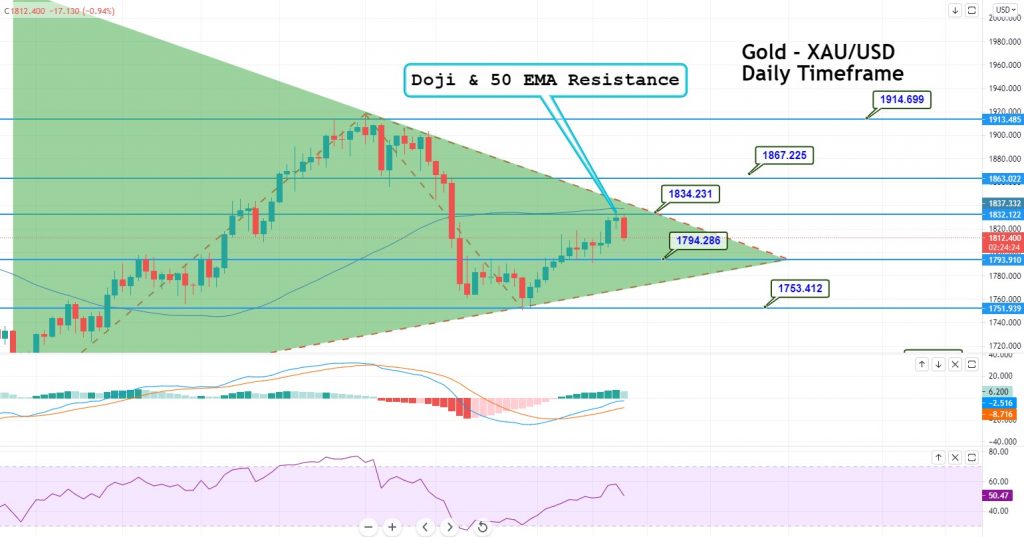
On the daily chart, gold has closed a doji candle right below an immediate resistance level of 1.834 level. As we can see on the daily chart, the downward trendline and 50 periods exponential moving average are extending hurdle to gold at 1,834 level. The formation of a Doji candle indicates weakness in the bullish bias and looks like the sellers are looming below the 1,834 level.
The daily leading technical indicators like MACD and RSI are still holding in the buying zone. However, it’s risky to take a buying trade until the 1,834 resistance level gets violated.
On the higher side, the bullish breakout of 1,834 level can extend buying trend until the next target level of 1,864/67 level. Whereas, the breakout of 1,867 resistance opens further room for buying until 1,900 territories. The U.S. Federal Reserve policy decisions will be playing a major role in the determination of gold price forecast.
Updated: Aug 04, 2021


