Copper – Forecast Summary
| Copper Forecast: H1 2021 Price: $3.78 Price drivers: Summer Impact, Bearish Correction, Doji Patterns | Copper Forecast: 1 Year Price: $4.89 Price drivers: Weaker Dollar Amid COVID-19-Based Stimulus, Upward Channel, 20 & 50 EMA Crossover | Copper Forecast: 3 Years Price: $4.21 Price drivers: Bearish Correction, Better Economic Conditions, Stronger Dollar, Hawkish Monetary Policiess |
Lately, Copper is encountering sharp bullish movements as the global economic conditions are recovering from the COVID-19 impact. Overall, the copper has added +$ 0.392 in its prices and is reporting a surge of 13.10% in a time span of just one month. Copper is currently trading at $ 4.14, bouncing off the Jan 2016 low of 1.9360. The commodity has gained +$ 1.097, or 38.67%, over the past six months. At the same time, it has added +$ 1.7119 or +75.99% in the past five years. The price dynamics of copper tend to forecast general economic trends, which is why copper is sometimes called the economic barometer. Copper has been widely used in electrical equipment like wiring, electronics like printed circuits, in construction for pipes and roofing, and much more.
Copper prices tend to rise due to increased demand at the time of growth in the economy led by massive manufacturing and construction activities. On the contrary, when the economy is going through a recession and economic and infrastructure activities stop, the demand and price of copper decrease. This is the reason that some economists say that copper even has a Ph.D. in economics. However, despite the great impact of the economic situation over copper prices, they tend to fluctuate even due to supply shortages or surplus and even because of the protective tariffs and many other such reasons.
China is the key country to watch while analyzing the market for copper as it accounts for more than 30% of the global imports amounting to $40.8 B in 2019. The second-largest importing country of copper is Germany that imports four times less than China. The enormous construction industry and high voltage lines of China need much more copper than it can produce locally, making the country a massive copper importer globally. In the case of exports, the countries which lead are Chile and Peru.
Recent Changes in Copper Prices:
| Time Period | Change in Dollar | Change in Percentage |
| 30 days | + 0.392 | + 13.1016 % |
| 06 months | + 1.097 | + 38.6768 % |
| 01 year | + 1.434 | + 55.0154 % |
| 05 years | + 1.7119 | + 75.9974 % |
| 10 years | -0.3026 | – 10.1185 % |
| Since 1990 | + 2.7804 | + 161. 2688 % |
Copper Price Prediction for the Next 5 Years
The year 2020 started with the price of copper hovering around $2.81, which then began to decline due to the coronavirus pandemic. After China went into lockdown followed by other countries around the world in March, the prices tumbled about 27% and reached $2.09. However, after March, the copper prices picked up a bullish pace and continued rising throughout the year. Copper prices kept growing for five months in a row and then saw a reversal momentum in September and October. However, in November, the prices reached $3.50, amid the rise in imports from China. The prices touched the $3.6 level in December and ended the year higher.
However, the prices have maintained the bullish momentum in the first quarter of 2021. Copper’s prices posted minimum gains in January, but for February, the prices rose sharply and touched a high of $4.37. Since then, the prices have been moving in a range of $4.2 – $4.0.
- Rise in China’s Demand & Stockpiles:
The demand for copper from China is expected to remain strong throughout 2021 as the International Monetary Fund (IMF) has predicted a 1.9% growth in the Chinese economy in 2020. It looks like China has controlled the spread of coronavirus, and there will be no need for another mass lockdown, and the factories will keep running. This will not im[act industrial productions and enhance the activity that will eventually increase demand from the world’s largest copper user.
Furthermore, more stockpiling from China is expected in 2020 as China has been building up its copper reserves to use them as a hedge against a possible deterioration in its relations with the US. If China incorporates the stockpiling in its next-five-year development plan, it will increase the Copper imports, and the prices of the metal will also rise given the surplus demand.
- Recovery on the Supply side:
The supply deficit of copper is expected to gradually ease during 2021 as most countries have come out of lockdowns and started production. Simultaneously, most countries will eventually start their economic activities after the easing of lockdowns as the coronavirus vaccine rollout has begun across the world. Another factor that would add to Copper’s supply is the new mines in Russia, Congo, and Chile that will also help increase copper supply.
- Green Energy:
As the world is becoming more and more aware of its impact on the environment, the need and demand for green energy have been increased. Green energy is a transition from conventional energy resources to renewable sources. The increased focus on tackling climate change has pushed the governments to increase adoption of green energy. Copper is the most common metal used in the generation, storage, consumption, and electricity transmission. Low-emission cars like Tesla are a good example of green energy and electric vehicles containing a mile of copper wiring. Electric vehicle sales and demand have rapidly increased and are expected to continue to rise in 2021. The focus shift toward green energy has already increased the demand for copper and is likely to continue supporting copper prices in the future.
- Weakness of US dollar:
The US economy’s long-term outlook is not promising compared to China, UK, or Europe. The growing deficits in the US, worse-than-expected labor market with millions of jobless Americans, massive stimulus packages, and a high tolerance for inflation from the Federal Reserve all negatively impact the US dollar. The weakness of the US dollar is expected to continue to support the prices of copper throughout 2021.
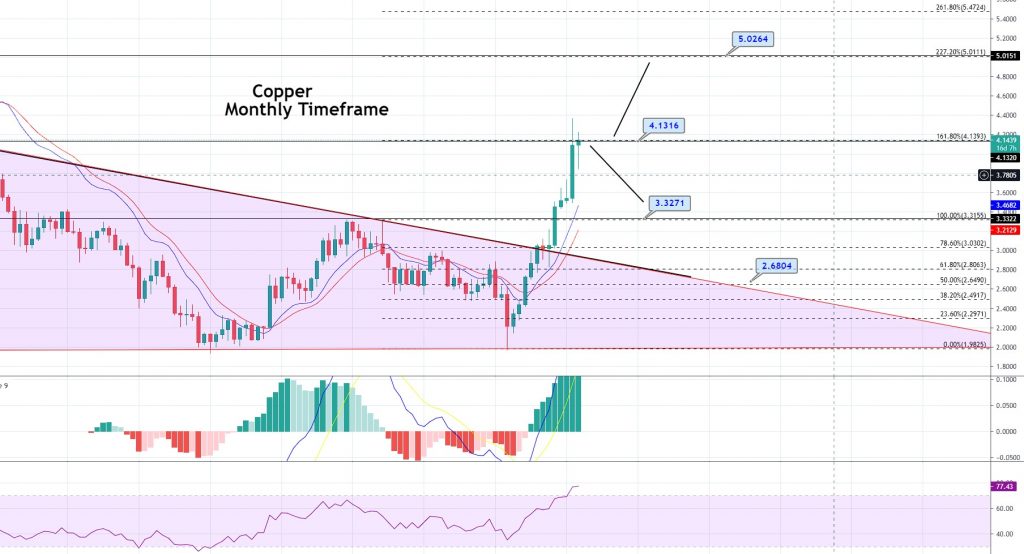
Considering all of the factors, the copper price is expected to exhibit a bit of bullish bias until the 5.01 level that also marks 227.20% Fibonacci extension; however, the prices may dip later on the back of profit-taking. In five years’ time-frame, the copper prices are likely to surge until the 5.011 level and retrace back until the 3.45 level.
Factors Affecting Copper in 2020:
- Fast Recovery in China:
During the first quarter of 2020, countries worldwide entered into lockdown; China also followed the drill and halted its economic activities, including construction, industrial, and all the sectors. This caused a sudden decrease in copper demand that ultimately dragged the prices almost 27% down for the year. However, China was also the first country to emerge from the lockdown, and by July, it started importing copper again. The fast recovery from lockdown and its impact on China’s economy returned the demand for copper in the market, ultimately benefiting the prices and keeping the bullish trend throughout the year.
- Supply Shortages:
The coronavirus pandemic also hit the exporting countries hard, and both the largest producing countries Chile and Peru went into long and harsh lockdowns. The halted production in both countries, disrupting copper’s supply as the International Copper Study Group (ICSG) reported a 20% down production in Peru during the first half of 2020. The output was so weak that the LME warehouse stock levels reached their lowest levels since 2005 in September. The shortages in copper supply were escalated after strikes and labor disputes rose in the third quarter of 2020 and supported the rally in copper prices throughout the year.
- Weak US Dollar:
The US dollar has remained under pressure throughout the year amid concerns of coronavirus’s impact on the US economy. The dollar also suffered due to the massive easing in monetary policy and interest rates. Greenback’s losses could also be attributed to the uncertainty of the US election and the victory of Joe Biden as the democratic leader had promised to add further aid in the economy through stimulus packages. The dollar-driven weakness by combining factors also played an important role in increasing copper prices as it made copper cheaper for buyers.
- Other reasons:
Other than the above-mentioned reasons, there were also many factors involved in fluctuating copper prices throughout 2020. The main factor was the negative impact of the coronavirus pandemic on demand for copper. The interruptions to international trade flow in scrap were also factors that drove copper prices in 2020. The strict import quotas from China also affected the copper prices throughout the year as the Solid Waste & Chemicals Management Centre of the Ministry of Ecology and Environment of the People’s Republic of China released 13 batches of import quotas throughout 2020. The mine production disruptions in America caused by the pandemic and new safety work protocols also impacted Copper prices. The unexpected strong recovery in Chinese cathode buying in the replacement of scrap and stockpiling purposes also affected the demand for copper in 2020.
Technical Analysis – Copper Enters Overbought Zone
On the technical front, the bulls are dominating the copper demand. Currently, copper is trading at the $4.13 level, and the leading technical indicator, the MACD (Moving average convergence divergence), is exhibiting a bullish trend in the copper. On the monthly time-frame, the MACD and RSI have crossed over the mid-level (0 level), and 50 respectively, which exhibits a strong bullish trend in the copper price. Copper has closed a bullish engulfing on the monthly time-frame that is suggesting chances of a further bullish trend in the commodity. However, the current monthly candle is likely to close a spinning top, followed by two monthly buy candles, demonstrating that bulls are getting exhausted and the sellers might take over the market now.

Copper – Monthly Time-frame – Descending Triangle Breakout
On the monthly time-frame, Copper has formed a descending triangle pattern which has now been violated around $3.03, and this level is now likely to provide support. The lagging indicators, such as the 20 and 50 periods EMA (Exponential Moving Averages), support a bullish trend, as copper prices have surged over all of these EMA levels. On the higher side, the monthly resistance remains at $ 4.33, $5.02, and $5.47. Conversely, the commodity may find support at the $ 3.327 level. If copper violates the support level of $ 3.32, we might see its price falling toward the $ 2.68 area.

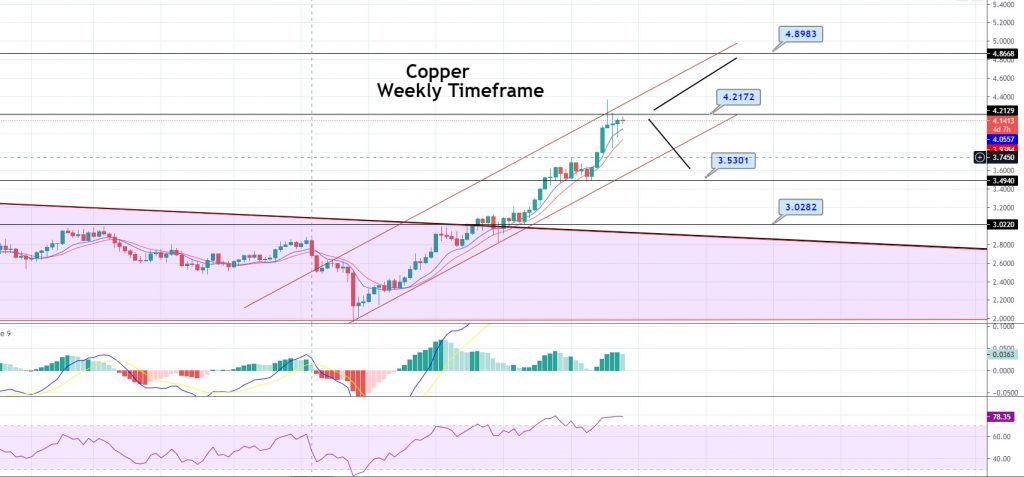
Copper – Weekly Time-frame – Upward Channel & Doji Pattern
In the short run, copper may exhibit a slight bearish correction until the $ 3.53 area extending the most recent low of February 2021. However, the bullish trend will remain solid if the commodity fails to violate the support level of $ 3.53. According to the MACD and Stochastic indicators, copper has entered the overbought zone, and bulls may start profit-taking before showing any further upward momentum in the market. On the weekly time-frame, copper prices have closed a Doji candle followed by a bullish trend. This kind of pattern suggests indecision among investors and typically drives bearish correction in the market. That being said, copper may find support at the 3.5301 area, and the bearish breakout can extend selling bais until the next target area of 3.0282. Conversely, a bullish breakout of 4.21 level can lead the price towards 4.8983. Good luck!


