Crypto Strategy: Moving Average Convergence Divergence (MACD)
Last Update: November 10th, 2024
The moving average convergence divergence (MACD, pronounced “Mac-D”) is a momentum-based indicator that illustrates the correlation between two moving averages of the same security’s price. Although the moving averages are customisable, the default setting for most MACD derivations is the 26-period exponential moving average (EMA) and a 12-period EMA.
The MACD indicator is graphed as two distinct lines: the MACD line and signal line. The MACD line is calculated by subtracting the 26-period EMA and 12-period EMA; the signal line is a constant 9-period EMA. In addition, a MACD histogram is implemented to monitor the distance between the MACD line and signal line. As price action evolves, this distance increases and decreases, indicating changing market conditions. While not foolproof, this information is useful in identifying trends, rotational markets, and pending reversals.
What is MACD?
Definition and Calculation
The Moving Average Convergence Divergence (MACD) is a technical indicator used to identify changes in the strength, direction, momentum, and duration of a trend in a security’s price. The MACD is calculated by subtracting the 26-period Exponential Moving Average (EMA) from the 12-period EMA. The result is known as the MACD line. A 9-period EMA of the MACD line is plotted as the signal line. This combination of moving averages helps traders understand the average convergence divergence of the price action, providing insights into potential market movements.
How Does The MACD Strategy Work?
The MACD is a flexible technical tool that may be used to spot trading opportunities and manage open positions in the live market. Much like traditional moving averages in forex trading, the MACD gives us an inside look at market conditions and the behaviour of price action. Accordingly, the MACD is a powerful tool for timing the market and identifying concrete entry and exit points.
In live market conditions, the MACD trading strategy is relatively simple to use. First, the trading platform automatically calculates and plots all values on a graph. Really, the trader’s only task is to monitor the relationship between the MACD line and the signal line. As in name, the moving average convergence divergence indicator signals two key events:
- Convergence: Convergence occurs when the MACD line and signal line come closer to each other. This suggests that the market is becoming compressed.
- Divergence: Divergence occurs when the MACD line and signal line are moving away from each other. This suggests that the market is trending.
A key element of the MACD occurs when the two lines cross one another. Known as a “crossover,” this event signals that price is changing direction as the MACD line (the “faster” indicator) crosses over the signal line (the “slower” indicator).
When the MACD line crosses below the signal line, it confirms a bearish signal, suggesting that traders should consider selling. Conversely, when the MACD line crosses above the signal line, it confirms a bullish signal, indicating potential upward price trends.
Upon a crossover taking place, price action is changing direction and possibly forming a new trend.
Understanding the MACD Line and Signal Line
The MACD line is calculated by subtracting the 26-day EMA from the 12-day EMA. The signal line is derived from the 9-day EMA of the primary line. The MACD line crossing above or below the zero line shows the 12-day and 26-day EMAs changing position relative to each other. The signal line crossing above or below the zero line can indicate a trend reversal.
This interplay between the MACD line and the signal line is crucial for identifying bullish and bearish signals, helping traders make informed decisions based on the convergence divergence MACD patterns.
How Is The MACD Strategy Used In Crypto?
MACD indicators are typically applied to the cryptocurrency markets within the framework of trend-following strategies. As a momentum indicator, the MACD helps traders identify the strength and speed of price movements in the market. They may be used on any timeframe, including intraday, day, or multi-day trading styles. In reality, your success in using the MACD to trade cryptos will depend upon how well you interpret the interaction between the indicator’s two lines.
Fortunately, deriving and reading the MACD isn’t difficult. Software trading platforms automatically calculate all values needed and plot them graphically. The trader is then able to visually determine a crypto’s market behaviour and craft decisions. Below are the basic interpretations of the MACD:
- Buy: It’s time to buy when the MACD line crosses above the signal line.
- Sell: It’s time to sell when the MACD line crosses below the signal line.
- Wait: It’s best to wait for further evidence when the MACD line and signal line are close together. Also, periods featuring frequent crossovers require additional patience.
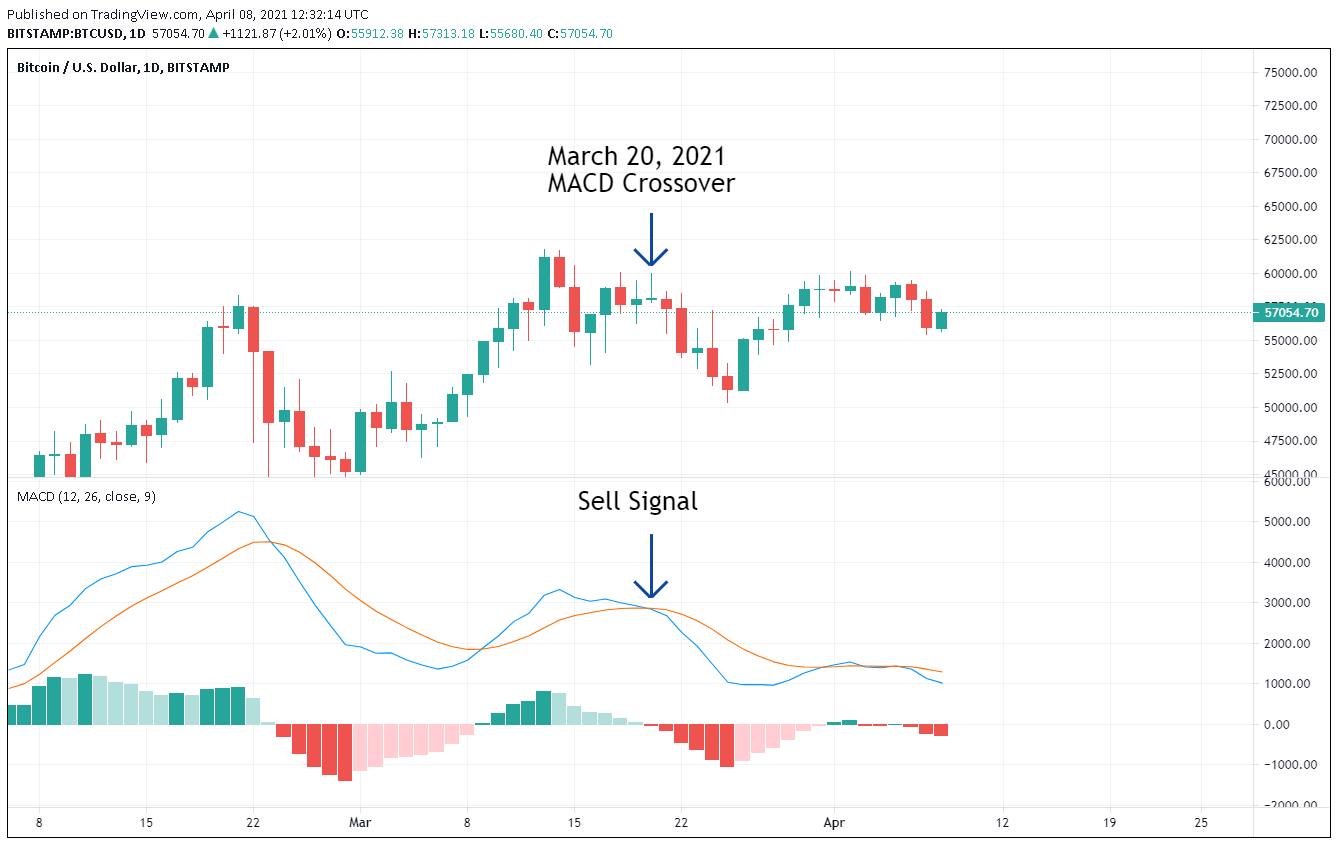
To illustrate how the MACD works, take a look at the Bitcoin (BTC) daily chart below. As you can see, on 20 March 2021, the MACD line crosses beneath the signal line. Now, the decision is simple: sell BTC. Although the market is in a long-term uptrend, there is a reasonable chance at successfully catching a retracement.
Things To Watch For When Trading Crypto With The MACD
Of course, no crypto trading strategy is fool proof and the MACD isn’t any different. In order to be successful, you must apply its parameters consistently within the live market. The key to accomplishing this task is to understand the following concepts:
- Trend Following: First and foremost, the MACD is designed to be a trend trading indicator. Accordingly, its strongest applications will be in spotting new trends and entering existing trends. One of the ways in which the MACD is especially useful is within the implementation of multiple time frame analysis. By applying the MACD to long-term, intermediate-term, and intraday charts, you can get a good idea of how micro price action fits into the broader, macro market direction. In this way, it is possible to fine-tune market entry on an existing trend or get in on a budding trend early. Using multiple technical indicators like RSI and Bollinger Bands alongside MACD can provide more reliable signals to confirm trends and make informed trading decisions. Although a higher risk strategy, the MACD may also be used to trade market reversals. Of course, a market reversal is simply a shift in the prevailing trend; the MACD can offer potential entry and exit points on reversals, which may lead to exceedingly positive risk vs reward scenarios.
- False Signals: Perhaps the greatest drawback to trading the MACD is the indicator’s propensity to generate false signals. A false signal is one that misleads the trader, often prompting the execution of a losing trade. During periods of quiet price action, compression, or rotation, the MACD line and signal line cross one another more frequently. This phenomenon causes a myriad of problems as the sideways price action produces an abundance of false signals. Unfortunately, the trader ends up constantly entering and exiting losing trades, as the market has neither a bullish nor bearish bias. The result of the process is a loss of capital due to transaction costs and constantly being stopped out. Before using the MACD, be sure that you are targeting an active cryptocurrency market. Amid slow price action, as we saw in Ripple (XRP) throughout the summer of 2020, trading the MACD can be a challenge.
- Risk Management: As with any trading strategy, it is imperative that you employ proper risk management principles with the MACD. Practicing solid risk management not only protects your risk capital, it furnishes you with the ability to trade for a longer period of time. No longer will your profit and loss be a product of chance; managing risk aggressively ensures that you will be able to take a higher volume of trades, thus establishing a verifiable track record. This is extremely important in the volatile cryptocurrency markets, as a swift crash or rally won’t destroy your trading account. While MACD strategies can be a viable long-term approach to the market, they aren’t infallible. Limiting leverage, reducing stops, and not overtrading are three ways that you can avoid falling victim to a bad run of luck.
Predicting Crypto Prices With The MACD
If you’ve ever traded forex, shares, or futures, then you know how difficult it can be to accurately forecast price action. Crypto price prediction is no different. A multitude of factors influence price on a minute-by-minute basis, making it a challenge to estimate how the market will evolve. However, the MACD indicator can help.
When forecasting crypto prices with the MACD, it’s important to think in broad terms. As the MACD line crosses above the signal line, price is likely going higher; if the MACD line crosses below the signal line, price is likely going lower.
As the distance grows between the MACD line and signal line, the market is trending; as the distance shrinks, a bullish or bearish reversal grows increasingly probable. A bearish divergence occurs when the price of an asset reaches a new high while the MACD indicator fails to do so, signaling that upward momentum is weakening.
Conversely, a bullish divergence occurs when the MACD indicator forms rising lows while the asset’s price forms falling lows, indicating potential strength in buying pressure despite the price drop.
Risk Management with MACD
Position Sizing and Stop-Loss Orders
When using the MACD indicator for trading decisions, it’s essential to manage risk effectively. Position sizing refers to determining the appropriate amount of capital to allocate to a specific trade based on your risk tolerance. Stop-loss orders are crucial for protecting your capital.
Based on MACD signals, consider setting stop-loss levels below the recent low for long positions or above the recent high for short positions. This will help limit potential losses if the trade doesn’t go in your favor.
By adhering to these risk management principles, you can safeguard your investments and enhance your trading strategy’s overall effectiveness.
Pros And Cons Of The MACD
Pros | Cons |
Readily adaptable to any timeframe or cryptocurrency asset | The MACD is not a leading indicator and can generate inaccurate data in fast-moving crypto markets |
Excels in the volatile trading conditions local to most cryptocurrencies | During periods of range bound crypto trade, false signals are common |
Easy to use in fast-moving, turbulent crypto markets | Whipsaw market conditions can undermine the MACD’s trend-identifying efficacy |
Common Mistakes To Avoid When Using The MACD
Unfortunately, there are a few pitfalls of using the MACD. Be sure to recognise these issues and work to remedy them when trading this strategy in the live cryptocurrency markets:
- Ignoring Market State: It’s important to recognize whether a market is moving directionally or sideways. Remember, sideways markets are not ideal for the MACD. Monitoring the MACD histogram can help traders avoid false signals by providing a clearer picture of market momentum.
- Too Much Leverage: Just because the MACD suggests that a buy or sell is warranted, doesn’t mean it’s appropriate to over-leverage a position. MACD signals aren’t infallible ― always use proper position sizing and leverage!
- Inconsistency: Taking the “human element” out of trading the MACD is critical to success. Many crypto traders use the indicator inconsistently ― if you’re going to trade the MACD, integrate it into a comprehensive trading plan.
Get Started!
If you’re looking for a user-friendly way of trading cryptos, then the MACD may be just what you’re looking for! It’s easy to configure and is available on most software trading platforms. Simply add the MACD to your cryptocurrency chart, evaluate the data, and begin crafting trading decisions. Understanding the MACD as a momentum indicator is crucial for effectively using it in your trading strategy. As long as solid risk-management parameters are consistently adhered to, the MACD strategy is a viable way of engaging today’s cryptocurrency markets.
FAQ: Moving Average Convergence Divergence (MACD) in Crypto Trading
1. What is MACD in Crypto Trading?
The Moving Average Convergence Divergence (MACD) is a momentum-based indicator used in technical analysis to identify trend changes, momentum shifts, and potential price reversals in cryptocurrency markets. It’s composed of two main lines, the MACD line and the signal line, along with a histogram that represents the distance between these lines.
2. How Does the MACD Work?
The MACD line is calculated by subtracting a 26-period Exponential Moving Average (EMA) from a 12-period EMA. A 9-period EMA of the MACD line is called the signal line. When the MACD line crosses above the signal line, it suggests a potential buying opportunity. Conversely, when the MACD line crosses below the signal line, it signals a potential selling opportunity.
3. How is MACD Used in Crypto Trading?
In crypto trading, the MACD is used to identify bullish and bearish signals, indicating when to buy or sell. Traders monitor crossovers between the MACD and signal lines to time entry and exit points. Additionally, the MACD can be used to gauge the strength of market trends and to identify potential trend reversals.
4. What Should I Watch for When Trading Crypto with MACD?
When trading with MACD, watch for:
- Crossovers: A bullish crossover (MACD line crossing above the signal line) suggests buying, while a bearish crossover suggests selling.
- Divergences: If the MACD and price movement diverge, it may indicate a trend reversal.
- Trend Following: MACD works best in trending markets. Avoid using it in sideways markets as it may generate false signals.
5. Can MACD Help in Predicting Crypto Prices?
Yes, the MACD can help forecast price trends. A widening gap between the MACD line and the signal line indicates a strong trend, while a narrowing gap suggests a potential reversal. However, while MACD offers insight into price direction, it should be used in combination with other indicators for a more accurate analysis.
6. What Are the Pros and Cons of Using MACD in Crypto Trading?
- Pros:
- Adaptable to any timeframe, making it suitable for both short- and long-term trades.
- Effective in identifying trends and momentum in volatile crypto markets.
- Cons:
- Can generate false signals in sideways markets.
- Not a leading indicator, so it may lag in fast-moving markets.
7. What Are Common Mistakes to Avoid When Using MACD?
- Ignoring Market Conditions: MACD performs best in trending markets. Avoid relying on it in choppy or sideways markets to prevent false signals.
- Over-Leveraging: Avoid using excessive leverage based solely on MACD signals, as it can increase risk.
- Inconsistent Application: For best results, use MACD consistently within a comprehensive trading plan rather than reacting to isolated signals.
8. How Can I Get Started with MACD in Crypto Trading?
To start using MACD:
- Add the MACD indicator to your crypto chart on your trading platform.
- Observe the MACD and signal lines, looking for crossovers and divergence to identify potential trading opportunities.
- Always incorporate risk management practices, such as setting stop-loss orders, to manage potential losses.
Sidebar rates
