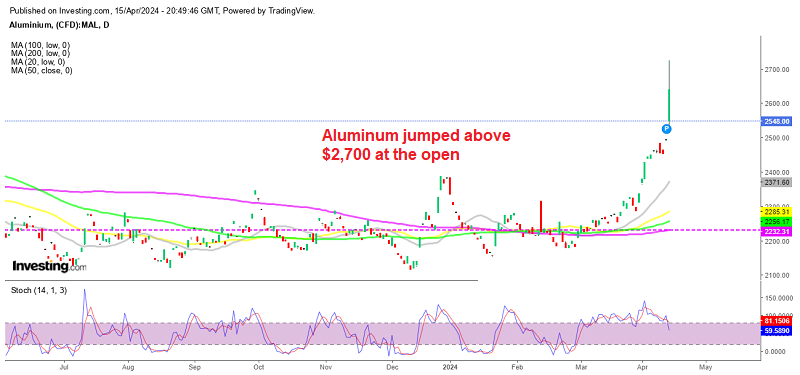
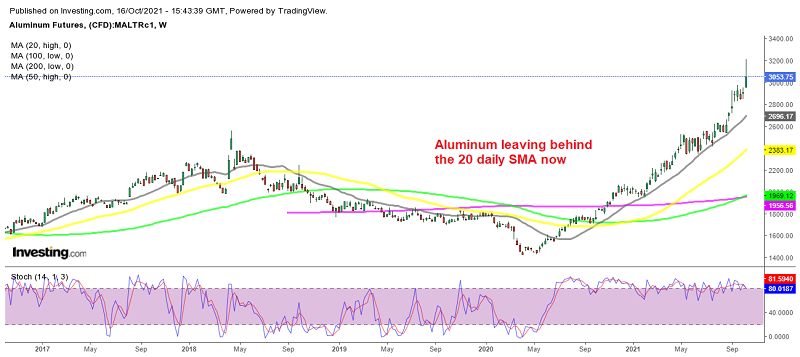
Aluminum is the second most widely used metal, after iron, and it is in high demand in the growing economies and for global consumption. It is generally used in Aircraft and Aerospace, Aluminum Cars, Automotive, Building and Construction, Electronics and Appliances, Solar Panel Nanotechnology and Foil and Packaging. The prices of aluminum are highly dependent on global demand, the construction industry and news from producers. The top three aluminum- producing countries are China, Russia and Canada.
The biggest consumer of aluminum, with a very high demand, is China, where urbanization has boosted consumption. China uses about 40% of the annual global supply of aluminum. After China, the next largest consumers of this metal are Japan, the European Union and the United States.
Aluminum prices have been linked to the growth in the Chinese GDP over the past two decades; it has pushed many industrial commodity prices higher. The packaging sector, real estate, transportation, construction and the electronics sectors in China and worldwide have raised the demand for aluminum.
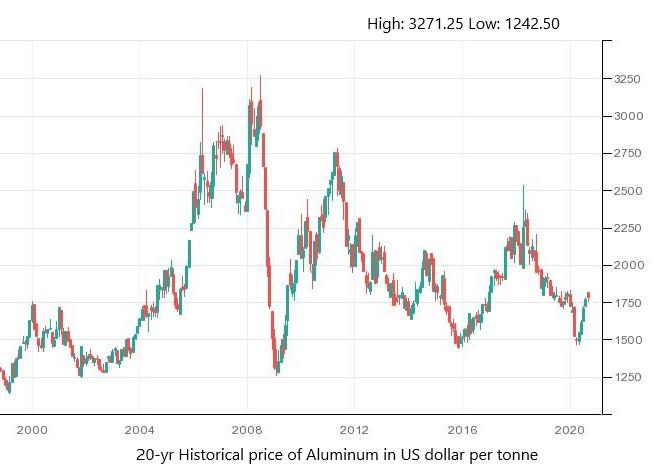
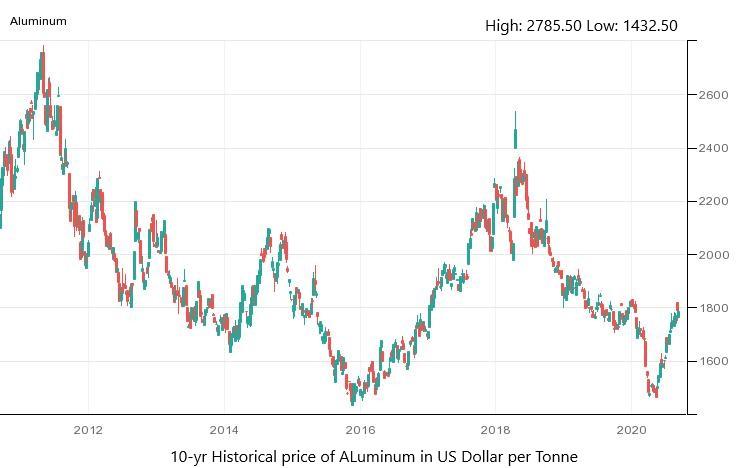
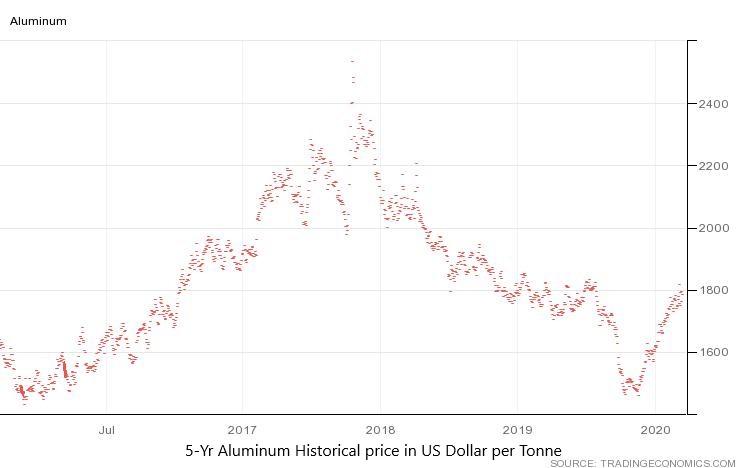
Why Look at Historical Aluminum Prices?
There are manifold factors involved in the determination of a bullish bias in aluminum. Let’s explore them one by one, in order to forecast the aluminum prices.
Chinese Demand and Overcapacity:
The biggest producer and consumer of aluminum is China, as the fast-growing Chinese economy has needed aluminum for construction, transportation and electronics in recent years. However, as the Gross Domestic Product of China dropped, the internal demand could not absorb the large supply, causing China to export the metal to the United States and other countries.
However, despite the massive aluminum overcapacity in China, the local government continued to pursue industrial policies, in order to expand the production. Over the past five years, China's overcapacity has grown by 60%, and this has resulted in a distortion of the global markets, due to increasing exports of the metal to third-party countries.
According to the National Bureau of Statistics, smelters in China produced about 3.02Mt of primary aluminum in June. This was the highest amount ever for June, as the total annual output was up by 1.7%. Despite this, the Chinese government set up a new production line, with a capacity of 680,000 tons per year in the first six months of 2020. These new capacities alone were equal to nearly 40% of the total US aluminum smelting capacity.
China also provided $ 60-70 Billion in indirect government subsidies to five aluminum-producing firms, and this played an important role in the overcapacity. This subsidized overcapacity of aluminum in China is a fundamental trade challenge, which the US aluminum industry is having to face, as they are going out of business.
Transportation Demand & Construction Industry Demand:
Automobiles and aerospace are the most important markets for aluminum in the developed world. The global economy depends on transportation to support growth. As the global economy expands, the need for automobile and aerospace also increases, and this causes a surge in the demand for aluminum.
As we know, in the first quarter of 2020, the global GDP in G20 fell by 3.4%, which was the record in terms of large contraction since 1998. This means that the aluminum prices also suffered, due to less economic growth, which led to low economic activity, which supports the transportation sector.
The aluminum consumption for the world's largest buyer of the metal, China, fell for the first time in three decades in 2019, to the tune of 1%. As a result, China made plans to add 2.25M tons to their annual aluminum smelting capacity. The second-largest industrial demand sector for aluminum is the construction and building
market. Aluminum amounts to about 30% of the cost of building materials in developing countries.
Construction figures are volatile, so the unemployment rates, job data, interest rates and economic growth activities in consumer countries, like China, the US, Europe and Japan, are an important factor in moving the aluminum prices.
The Great Canadian Aluminum Distraction:
Recently, the US Trump Administration re-imposed tariffs on aluminum imports from Canada, amid the surging supply, which rose above the historical levels. But the rise in Canada's aluminum exports to the United States had only intensified in recent months, despite a drop in demand from the US. This called for a move to secure the domestic aluminum industry.
However, the next day, Canada retaliated by announcing tariffs on US aluminum products, on the grounds of national security. These tariffs have also kept the aluminum prices under pressure recently.
Coronavirus Pandemic:
The automotive manufacturing and construction sectors were primarily affected by the coronavirus induced lockdowns, which significantly affected the aluminum industry worldwide. Aluminum prices dropped from $ 1,820 per ton in January to $ 1,425.5 per ton in April.
However, the prices were not as affected by the coronavirus as other commodities were, because as the demand for that metal decreased from one sector, demand in other sectors increased. The demand for the transport, construction and consumer electronic sectors decreased during the pandemic lockdowns. But, at the same time, the demand for aluminum increased for printed circuit board components for medical devices, like ventilators.
The supply chain was also interrupted, due to the travel restrictions and the closure of ports; however, the supply of aluminum was not affected.

