The Uptrend Is in Question in Dax, as the 100 Daily SMA Gives Way
Dax has reversed lower and has broken below the 100 SMA on the daily chart
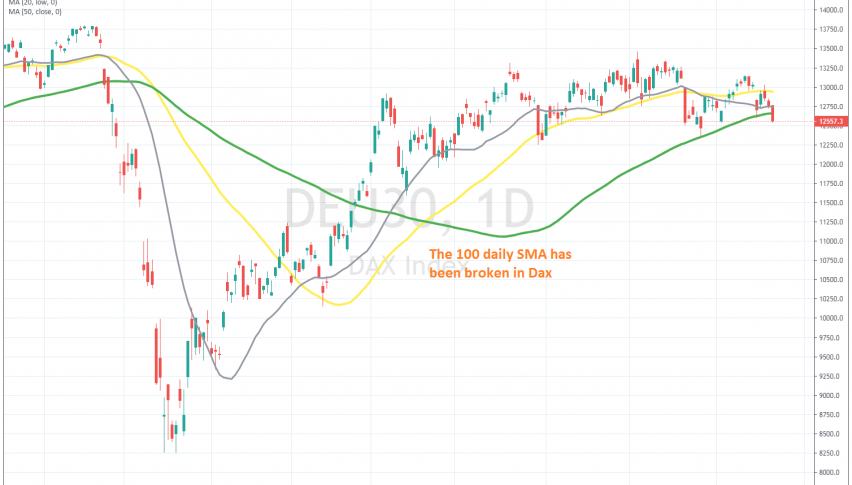
Stock markets have been on a bullish trend since the middle of March, following the crash in the prior weeks. The German Dax index climbed around 5,200 points, nearly making up for all the losses of that crash. During this time, moving averages were providing support.
The 20 SMA (gray) was doing that job initially, when the pace of the uptrend was quite strong, then the 50 SMA (yellow) took its turn on the daily chart. But, the 50 SMA broke towards the end of September and the price declined, reaching the 100 SMA (green).
This moving average held the decline back then, and it held again last week, but the 50 SMA (yellow) turned into resistance this time and rejected the Dax on Monday this week. The price formed an upside-down hammer, which is a bearish reversing signal, and the 100 SMA was finally broken.
So, all moving averages have been broken on the daily chart, which puts the bullish trend in danger now. So, we will follow the price action in the coming days; if Dax climbs above the 100 SMA soon, it will mean that buyers haven’t let go yet and we might go long. If it stays below the 100 SMA for too long, then we will remain out.
- Check out our free forex signals
- Follow the top economic events on FX Leaders economic calendar
- Trade better, discover more Forex Trading Strategies
- Open a FREE Trading Account
Related Articles


Comments
Sidebar rates
Related Posts
