Platinum was on a steady uptrend during the 1990s and for most of the 2000s, as the demand for this metal kept increasing, due to its wide range of applications in different industries, and also because of its increasing safe haven status for long term investors, while global production of the metal wasn’t exactly keeping up. It surged for about a year during 2007-08, reaching $ 2,300 per ounce, but lost ²/ 3 of its value during the 2008 crash. Although it recovered pretty well in the following years, the price has been in decline since 2011-12, bottoming out at $ 565 in March 2020, which shows that the demand for platinum has been in a constant decline in the last decade. Here, we will take a look at the fundamentals and the technical analysis for platinum, as well as a forecast of the possibilities and the future price.
| Period | 3 Days | 1 Week | 1 Month | 3 Months | 6 Months |
| Change | +7.2% | +4.6% | +17.5% | +22.7% | +0.6% |
Platinum enjoys pretty much the same status as gold; it is used in jewelry, but at the same time, it is also a commodity which is used in the automobile industry, as well as in other industries. It also counts as a safe haven, which, at times, is one third more expensive than gold. But, as mentioned above, platinum has been declining since the beginning of the last decade. There are a few factors that have led to this, which we will take into consideration in this article. First of all, the global situation has changed since the outbreak of the coronavirus early this year – no assets have been trading normally since then, and platinum is no exception. It has, however, been following a strong uptrend since the middle of March, but the continuation of the uptrend is shaky, as buyers are pushing the price higher, making it less attractive.
| Platinum Forecast: Q4 2020 | Platinum Forecast: 1 Year | Platinum Forecast: 3 Years |
| Price: $ 1,050-$ 1,100 Price Drivers: USD correlation, Sentiment, Covid-19 | Price: $ 900 Price Drivers: Price Drivers: Risk Sentiment, Technicals, USD Correlation | Price: $ 500-$ 550 Price Drivers: Decline in Demand, Long-term Technicals, Electric Cars |
Platinum Price Prediction for the Next 5 Years
Platinum is a commodity that has often been more expensive than gold. As such, it has been prone to supply and demand on the commodity market as a whole, as well as to supply and demand for platinum in particular. Apart from palladium, most of the commodity market has been declining over the last decade, although the increase in demand for palladium is directly connected to platinum, and we will analyze this phenomenon in this article. Platinum is also a safe haven, which makes it vulnerable to the risk sentiment in financial markets. This makes forecasts for platinum, especially for the years ahead, a bit tricky, although that’s the story with most assets right now, as witnessed by some incredible volatility and some large moves this year, due to the coronavirus and the associated lockdowns, which made major global economies contract considerably. So, the volatility is bound to continue across all markets, including platinum. Let us now have a look at what is/might be affecting platinum in the mid-term future.
Supply and Demand
Supply – As mentioned above, as a commodity, platinum is prone to the forces of supply and demand. The particular trait for platinum is that most of it is produced in South Africa. South Africa is a large producer of many raw materials, but 75% of platinum production is concentrated in SA, which makes the supply side vulnerable to social, political, weather or other events that take place there. In the last few years, platinum production has suffered in South Africa. The main problems have been labor disputes, political instability, the instability of the South African Rand etc. These events have led to disruptions in the production during the last 2-3 years, which, in addition to the worsening risk sentiment, has been another reason for the increase in platinum prices since 2018. Now, the outbreak of the coronavirus has forced big producers, such as Impala Platinum and Anglo American Platinum, to remain closed, due to lockdown measures. I don’t know how social distancing works in mining, above or below the ground, but if that is an issue too, it will be another problem for the supply side. That’s another reason for the increase in platinum prices since the middle of March this year.
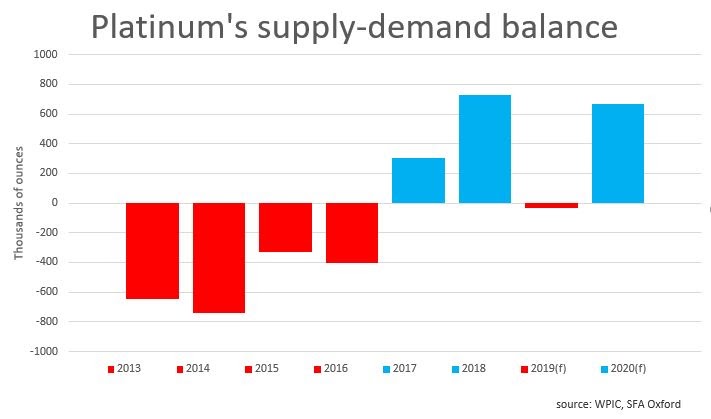
Demand – The demand side has a big say in any commodity, and platinum has been hard-hit in this regard, due to the decline in the demand in the last decade, especially since the issues with Volkswagen in 2015, who as we know, rigged their carbon emissions testing, lowering the results for diesel cars, in which platinum is used in the exhaust system. The car industry started shifting their demand from platinum to palladium, and to some extent also rhodium. As we know, the price of palladium has been surging since 2016, from around $ 400 to just under $ 3,000, and the shift from platinum to palladium in the automobile industry has been one of the main aspects for this increase, since it is a long-term factor. But, that is rather negative for platinum, hence the decade-long decline. Although there have been some positive developments for platinum in this regard, on the flip side, the progress of electric cars will eventually kill the demand for this metal in the automobile industry too. Besides that, the demand for jewelry has been declining, despite the world getting richer, which is another negative indicator for the future of platinum in the mid-term. Speculators and investors have been a factor in pushing up the demand for platinum since 2008, as platinum prices fell to lows at around $ 750 at the time, which made it really attractive for investors, and this was once again the case from March 2020, when the price fell even lower, to the $ 560s. But speculation alone is not enough to keep the platinum prices moving higher, especially once the US elections are over and the situation gets calmer in the country in 2021. The chart below shows the increasing surplus between production and demand over the last few years.
Market Sentiment and COVID-19
The sentiment has been mostly negative for safe havens since 2011-12. The world started to leave the 2008-09 financial and economic crisis behind, so safe havens started to turn bearish, after the 2-3 year recovery period. Platinum was no different; it started declining in September 2011, and continued that trend until 2018, when it started to retrace higher, as a result of the US-China trade war. Since 2011, we have only seen platinum make some decent retraces to higher levels on two occasions – once in 2016, when the sentiment turned negative following the Brexit vote, and once in 2018-19, as a result of the trade war. On both occasions, the sentiment was the deciding factor. So, while the global economy was recovering during most of the last decade, and the market sentiment was positive, platinum declined. When the sentiment turned negative, platinum turned higher, as did other safe havens, such as gold. The crash from January until March was due to the USD correlation, which we will explain below, but the reversal since mid-March has been a result of the improving sentiment. The risk sentiment hasn’t exactly turned positive in recent months, but at least it has improved, compared to the abyss that it fell into during February/March, hence the bullish reversal in platinum. This seems contradictory for platinum as a safe haven, but the bullish momentum of the last several months can be attributed to its commodity status, since the global economy sank to the lowest levels and has now started climbing up, on the whole. Besides that, safe havens are also increasing, as the uncertainty for the future remains high. Speaking of that, the uncertainty will remain high until the US election and probably for a few months thereafter. That is likely to keep platinum well bid, but on the other hand, the economic rebound will slow down or even start to fade in the coming months, especially if the coronavirus and further lockdowns keep hanging over our heads. So, for platinum, it’s going to be a fight between the safe haven status and the commodity status. However, we still see the precious metal moving higher until the end of the year, but at a slower pace than it has been in the last few months.
XPT/USD Correlation
As with most other commodities, to get a complete idea of the price action and behavior in terms of platinum, we must look at the correlation with the USD, to determine whether it has followed the price action in the USD or if it has had a mind of its own. Because, if it follows the USD closely, we can predict the future of the commodity by predicting the future USD price action. Looking at the two monthly charts below, we see that the DXY only surged once between July 2014 and March 2015, while trading sideways most of the time. The XPT/USD on the other hand, has been on a constant bearish trend. This shows that the correlation with the USD hasn’t been very strong. This takes out the USD side when trying to predict the future of platinum, which makes it easier to trade in the longer term, although the correlation has increased in 2020. The DXY increased during the first three months of last year, but started to plunge in April. The XPT/USD on the other hand, took a plunge during the first three months, but then reversed, and it has been bullish since then, showing that correlation has increased. But the same applied to most commodities in 2020. That brought further gains until the end of the year, but then the correlation broke up again.
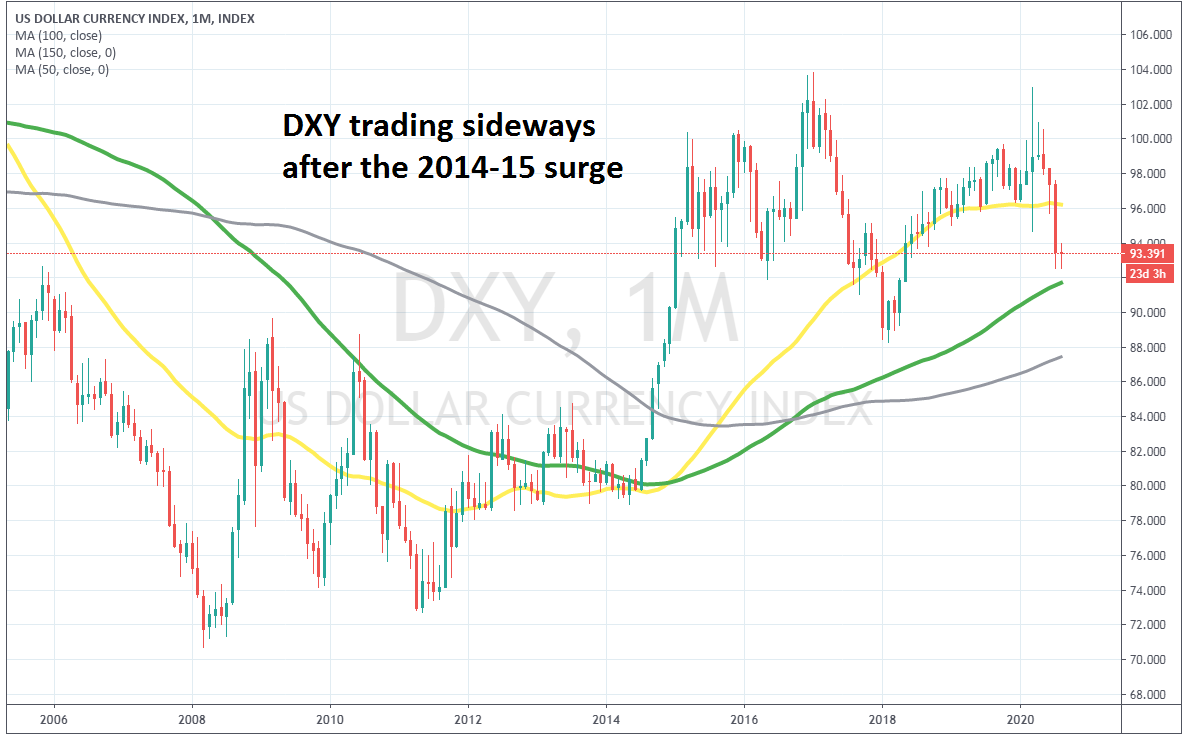
The USD index has been trading sideways since 2015
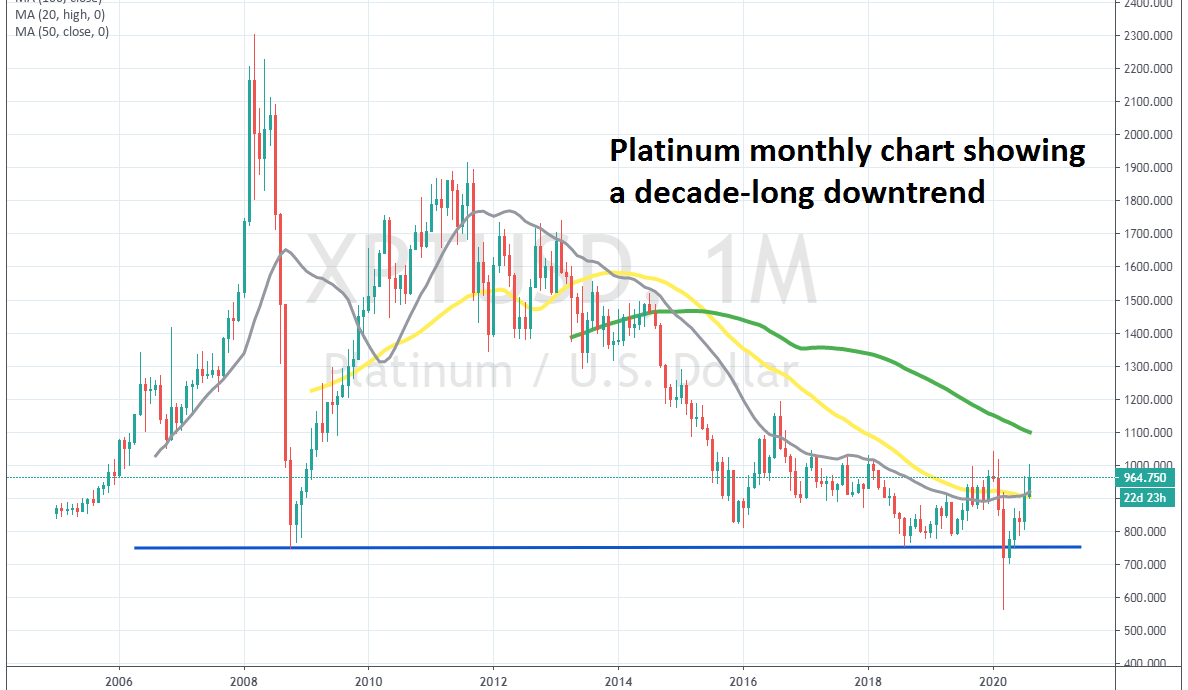
Platinum is on a long-term downtrend, despite the recent retrace higher
Technical Analysis – How Long Will the Retrace Last?
As the monthly chart above shows, the XPT/USD has been on a steady bullish trend from back in the 90s. The pace of the trend picked up considerably during 2006-07, while in Q1 of 2008, platinum prices surged higher, reaching a record price of $2,302 in March that year. Then came the 2008 financial crisis, which sent the XPT/USD diving lower, to around $750. But, platinum recovered well in the following years, climbing to $1,920 by August 2011. That’s when the current downtrend started, and platinum has been on a bearish trend since then.
During the uptrend until 2008, the 20 SMA (gray) provided support for the XPT/USD on the monthly time-frame. But that moving average turned into resistance in the past decade, which was another confirmation that the trend had changed. This moving average was a good indicator against which to sell platinum. The previous support at $ 750 was broken during Q1 of 2020, during the crash, which came after the upside-down pin candlestick in January signaled a decline. However, the price reversed, rising above the 20 SMA and the 50 SMA (yellow), which was also a sign that the larger downtrend might pause for a while. The 100 SMA (green) hung on above this, at $1,100, but that moving average wasn’t much of a hassle for either buyers or sellers. But it turned into resistance at the end of the year, once the US elections were over.
Overall, the long-term analysis points to a continuation of the bearish trend for platinum. The fundamentals are dovish, with the demand from the automobile and jewelry industries in decline. Electric cars will dampen the demand even further, as the use of e-powered cars will keep increasing. At that time, the situation was quite bullish for platinum, which allowed it to benefit from the improving sentiment as a commodity, as well as from the increased uncertainty as a safe haven, similar to gold.
